| "Sharing
the Secrets of Making the Best Online [Gold Investing and Silver]
Future Trading Worldwide" |
 |
| | Best
Online Trades Complimentary Newsletter - May 13, 2004 | "Future Trading and Commodity Trading with Courage, Conviction, and Knowledge"
SnP,
Oil and XAU
The
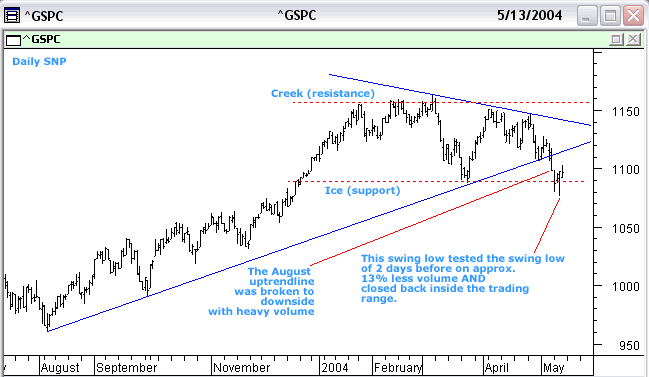
SnP500 has decisively broken through the uptrendline of August 2003 and did so
on heavy volume. That event was clearly a bearish signal coming out of the last
4 months trading range. However, the action of the last 4 days suggests that the
SnP is not willing and/or ready yet to break the Ice (Support) line indicated
by the lower dotted red line.
But why? Well, the intraday swing low of
Wednesday tested the swing low of 2 days earlier on lighter enough volume to show
that this market is not ready for a break of support at 1090. The 3 days price
action around 1090 could almost be considered a bullish spring of sorts and could
very well be setting us up for an aggressive bounce going into option expiration
next week. Volume and a negative price close simply did not come in when it had
to on Wednesday. We must respect these signals and what this market is trying
to tell us.
If a market or index fails to take out the previous lows, then
it will try to take out the previous highs of similar degree. The lows and highs
in this case are the creek and ice levels as indicated by the red dotted lines.
So we must be open to the possibility now that the SnP will trek back up to try
to take out 1150 and 1160 area. Near term though the most significant challenge
is the 1115-1120 level which would put the Snp right back up to the bottom side
of the August uptrendline which was broken with volume. It remains to be seen
how strong a bounce the SnP can muster up here after showing us it lacks near
term conviction to the downside. The upmove and mid range close and meager volume
today (Thursday) was not very good follow through after yesterday's close, however,
the fact remains for now that we are back inside the trading range after volume
selling exhaustion. |

I
said in the April
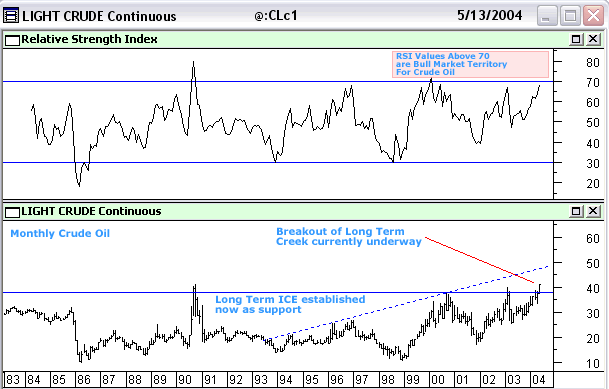
28th BOT letter that "...the crude oil chart also is showing me that
it wants go into 'acceleration mode' if a breakout actually occurs". This
appears to be happening now as we see that crude oil has 'jumped the long term
creek' which has now become support. For the breakout to be valid, we want to
see good price spread and closes (perhaps 2 to 4 strong monthly price closes)
The
chart below is monthly prices so I am making the assumption that the last half
of May will see either stable or higher prices for oil. A strong monthly close
for May will keep the 'valid breakout' case for oil intact. That is what to watch
for here, the monthly close for May. Until we have the final monthly close
for May, there can still remain the possibility that oil will create an upthrust
from the long term creek level of 38. If we do get the upthrust, it would merely
delay the ultimate breakout of 38 in my opinion.
The daily chart of crude
really does still look like a price chart that is in acceleration mode. My forecast
is for 48 crude by August 2004. That would put the price right under the dotted
blue channel line seen in the chart below. Crude Oil could go as high as 60 which
would correspond to an RSI value of around 80. That price and RSI level would
be consistent with the case of crude oil being in a major bull move here. For
now though, the major obstacle and target remains 48. |

BACK TO TOP OF PAGE
Previous
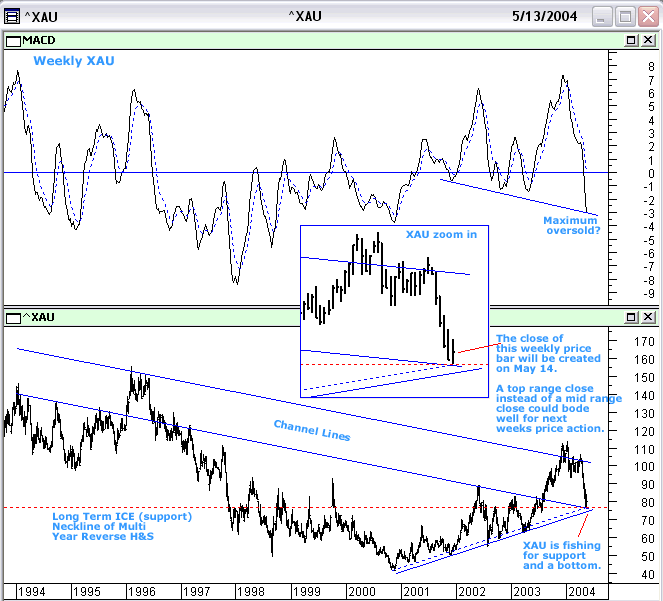
to this week, the XAU has made 5 consecutive negative weekly price closes. I think
XAU is now fishing for support. This weeks price close could very well further
the case of a solid low being in place. As of Thursday we have a mid range close.
If we stay at a mid range weekly close it could imply that the low of this week
wants to be tested one more time. But a strong Friday upmove could create a more
bullish weekly close and open us up to the possibility of some upside weekly follow
through next week.
Support is seen from the apex of the large 2002-2003
triangle, the lower part of the long term channel line, from the neckline of the
large reverse H&S pattern, and from the uptrendline on the XAU since late
2000. These are all significant areas of support for this mining stock index.
The bull case for the mining stocks pretty much rests right on that longer term
blue uptrendline since late 2000. That uptrendline must hold to keep the bull
case for next 1.5 years intact.
The mining stock sector and indices are
famous for their very deep retracements and seemingly impossible upside reactions
from such retracements. This bounce could take us to 90-95 level over the coming
weeks before being met with another downside reaction. |

BACK TO TOP OF PAGE
May
13, 2004
Thomas
Carreno
BestOnlineTrades.com
 | Not
currently subscribed
to the BOT complimentary
newsletter?
Sign
up at this link | This
newsletter's link is:
http://www.bestonlinetrades.com/newsletter/comp05132004.html |
|
|
|
|