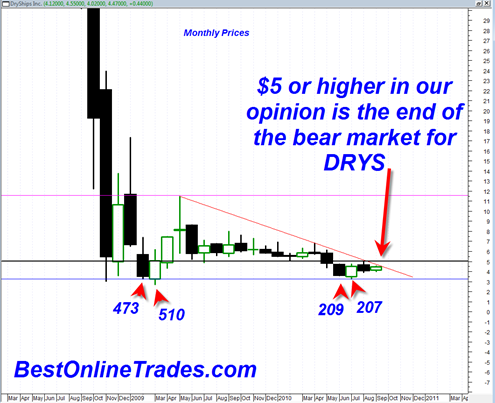
I am issuing a new long term buy signal on DRYS DryShips Inc. as of this week. I have been keeping DRYS on my radar for a long time. I only look at it occasionally and most of the time nothing jumps out at me. But today after reviewing the longer term charts I have a new opinion.
The opinion I write about in this post is definitely more of the longer term variety or the position trade (6 to 12 months or longer) variety if you will. The older I become, the more I realize that the best online trades are those that represent longer term time frames and cycles. Certainly there is nothing wrong with grabbing a quick 5% profit, but there is something peculiarly gratifying about continuing to profit for an extended period of time as a new trend emerges. The challenge is being able to properly identify the bottom of a stock cycle from a stage 1 base into a stage 2 advance. Then the trick is to try to ride up the stage 2 advance long enough for a tidy profit.
DryShips Inc. is a play on the commodity boom and bust cycle. Most recently we had a huge bust in the commodity cycle when oil collapsed from 140 to 35 dollars. The previous commodity boom cycle shot oil up from 50 to 145 between early 2007 and mid 2008. That boom in the oil price sent DRYS from 9 to 126 dollars or 1300%. The decline phase of the oil price sent DRYS from 113 to 3 dollars or 97%. So clearly we have seen a huge boom and then a huge bust. But I do not believe DRYS is going bankrupt any time soon. And now that I see the stock and commodity indices starting to boom again, I feel that DRYS is at a major final low point and ready for a new bull market soon.
The correlation between the long term price chart of DRYS and the oil price is interesting. There is not a perfect correlation but I definitely do see a correlation.
The oil price peaked in June of 2008 near 145 dollars. DRYS also peaked near 115 dollars in very early June 2008 as well after forming a very significant double top. But DRYS had already peaked much earlier than that. It made its final peak on the formation of the double top
Then after the commodity crash DRYS made a final bottom by end of February 2009. The final oil price bottomed in mid February 2009.
Since the bottom in both oil and DRYS, both have traded marginally higher from the all time lows in a long trading range fashion. The oil price has held steadfastly above 70 dollars in a tight trading range, but DRYS has traded almost back down to its initial first bear market lows hitting 3.28 within the last couple of months.
There has been heavy dilution to the share structure of DRYS, but that does not mean that the stock can’t do a double from here.
The off shore drilling ban is likely to end before the end of November and maybe even before the election? That should provide another surge to the DRYS price.
But more important than that would be a DRYS price move in OCTOBER that takes the price to 5 or higher. That in our opinion will end the bear market in DRYS and send the price likely much higher on the longer term time frame.
There are a few caveats however. Ideally we want to see the oil price ALSO break out north from its long sideways consolidation. It has held strong in a tight trading range above 70 a barrel. It is coming to a pivot point soon and may break north for a new run eventually towards 110 to 120 a barrel. Clearly, that move will take some time, but it is a very important requirement to help keep the wind in the sails of DRYS. But DRYS does seem to have an ability to lead the oil price higher, so to say that one should desperately wait for the oil price northward move is not really correct either. More important is that the oil price not violate 70 to the downside.
I did a couple other postings on DRYS in the past which you can reference here and here. BestOnlineTrades talked about DRYS when it was trading at 3.91 and indicated and I quote, “weekly close above 3.91 this week is a buy signal” which references the week of July 13, 2010.
There are a couple other points to be aware of. Even if DRYS does get an eventual break ABOVE 5.0 in the weeks ahead (as I believe it will), it does not guarantee of course that DRYS is going to go up in a straight line. There is still the longer term risk that the price may be contained within the longer term trading range between 11.5 and 3. OR it may be capped at a lower range of between 7 and 3. The determination where it might be capped is somewhat dependent on how robust this renewed commodity up phase is in addition to the new potential oil price bullishness.
There is a lot of heavy congestion in the high 6 range. Only breaking above 8.5 and 11.5 would send DRYS into much clearer skies so to speak. And it goes without saying that this is going to take a lot of time (which is why I am identifying this as a position trade).
In the chart above I identify a few important monthly price swings labeled with volume. You can see that the recent double bottom retest has two monthly price swings with 50% less volume than the first touch in 2009. This is bullish and further supports the argument that a new up trend cycle is about to start in DRYS.

