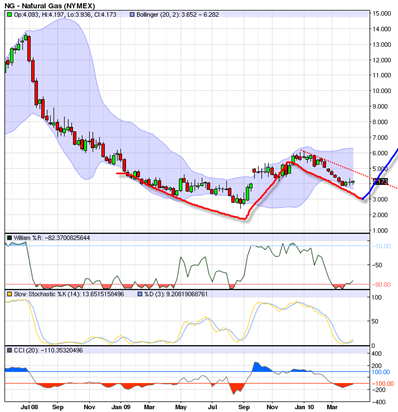
I am still watching the Natural Gas Contract fairly closely. I thought originally that Natural Gas Futures would trade down near the 3 level as a final bear market low. But there are a few elements in the current chart that have me at least considering otherwise at this point.
The the weekly chart of Natural Gas is used along with the Bollinger bands it paints a possible picture of a large W bottom forming with the Bollinger bands serving as support.
I recently just read over John Bollinger’s book on Bollinger Bands and he indicates through his book the identification of W bottoms along with the Bollinger Bands as confirmation.
He indicates that one might at first see price move out side of the Bollinger bands to create the first portion of the W bottom, then some type of rally can occur and then a retest of the Bollinger Band that does not break through the second time. the second retest is also typically right portion of the W pattern before the new uptrend emerges.
The fact that at least so far natural gas has held the 4 level for the last 4 weeks is constructive. Of course it can still break down from here, but it is looking like it might hold combined with the weekly Bollinger Band Support.
It is possible that natural gas may trade sideways for the next month or so, but I would view a northward break of the 4.50 range as a sign that this W bottom is for real and that a major new uptrend could get underway. But until that happens I have to still presume sideways to down for now.

