The tape today was weak but it had the disguised appearance of being constructive. The slow grinding type pattern could have been interpreted a number of different ways.
My first reaction to today’s tape action was “where is the beef” ? The previous two market trading days were essentially reversal hammers. And so the questions begs, why did the market not get a very sizable upward reaction rally in response to the supposed two reversal hammers we say in previous two days? This is an important question to ask because in the past the market would have readily eaten up such hammer candlestick reversals in the form of a huge UP gap and go the following days. The market was given two chances and it failed to deliver on the ‘easy pitch’ it was given.
Another interpretation of the recent 3 to 4 days price action in the market is that the market is simply churning through support. In bull market action this support would have been readily bounced off of ( in the up direction) but in bearish type trends the tape action simply turns into ‘mud’ and you get some messy hammers and reversals that slow down the downward direction. But then when the support is eclipsed you tend to see a rapid drop thereafter.
The market is currently oversold however this time period does remind me of the August 2011 time frame in the sp500 where we saw the market almost literally plunge with an unbelievable relentlessness. In August of 2011 we saw the market drop day after day with an amazing persistence. That type of move was possible because the Relative Strength Index made it to the 30 percentile line and then plunged down to the 16 level which was on par with previous mega crashes (ie. 1987).
 So one cannot rule out that such move could occur again, although it may be not highly probably given the extreme degree of oversold that would be necessary.
The bottom line on today’s tape action was that it was a failed bounce attempt after having been given plenty of opportunities to do so.
So now it opens the door for bearish resumption and likely acceleration to the downside (in the form of a wide range price bar).
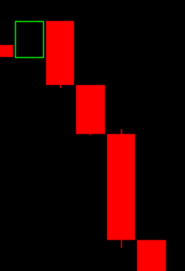
To get a grasp on what level of decline is about to unfold focus on how the candlestick bars close during the next few trading days. If you see repeated 20/20 type candlestick bars that form on a repeated basis be very careful as it could imply a final massive acceleration bar that could be defined as a crash.
These are the types of bars I mean when I say 20/20 bars. Full red candlesticks with the close near the lows and the open near the high. They are never perfect but if they resemble the bars in this image to the left then look out below.
