Today the sp500 broke with strong conviction the previous low set on 5/18/2012. This was a decisive bearish close very close to the lows of the day and in my mind shows clearly that we are in a continuation downtrend for the next several weeks.
There are a few issues however.
The downside volume in the SPY today was less than stellar. On 5/18/2012 we saw 320 million shares. Today we only saw 250 million. So this says to me we traded down with strong price conviction without the real ‘beef’ behind it. The beef in this case is the volume. The DIA had equal or greater volume than the 5/18 swing and the QQQ also came up a bit short. So some conflicting signals.
However price still rules and it was a decisive close below the previous low today.
So does the lack of volume suggest we have to power higher from here?
Not at all. As long as price is able to close solidly under previous support then it still tells me price can and wants to move lower. However, it also suggests to me that if we do get a strong continuation down during the next two weeks, I think we could eventually see an upward counter trend rally that comes pretty close to where we are trading today.
The alternative scenario is that we attempt to rally a little bit on Monday and ‘churn’ a bit before resuming lower. But the bottom line is that I see much lower prices during the next two weeks so the daily action may be a bit of distraction at this juncture.
As mentioned in a previous posting we have a strong forward looking event being the Greek Election coming up on June 17, 2012. We also have the Fed Meeting coming up on June 20th, 2012.
These two forward looking events occur in roughly 10 to 14 trading days which is about the equivalent time frame of the first leg of this recent decline that started on May 1, 2012.
So in terms of time it seems highly probable to me at this point that we will see more selling for the next 10 to 14 trading days.
The Fed meeting on June 20th 2012 is an ideal point of reference that could serve as a stabilization / market relief zone upon which it can attempt to rally and work off what will likely be an extreme oversold condition.
How fast will the sp500 drop next week ?
I see two possibilities…
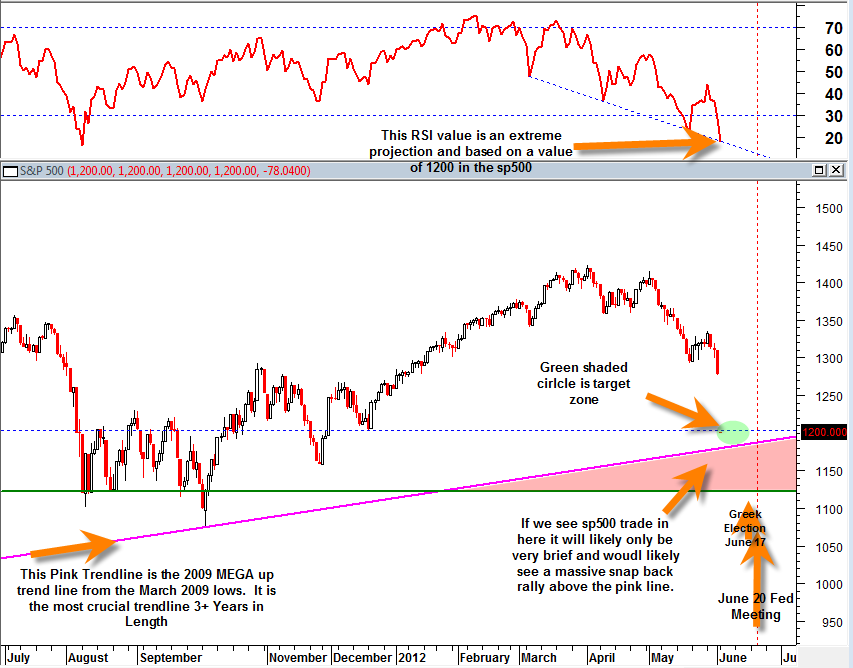
My general target on sp500 is 1182 to 1211 before June 20, 2012.
I can’t rule out a mini stock market crash down to these levels this coming Monday June 4, 2012 that creates a spike low with perhaps a long candlestick bottoming tail.
The more likely and conservative scenario is a 10 to 14 day decline that eventually hits the sp500 zone just mentioned.
Violating 1182 on a daily closing basis would engage the ultimate crash scenario which I view as very unlikely at this point. The long upward sloping PINK line in the chart below should at a very minimum serve as a market bounce stabilization zone.
My current view is that we will HOLD 1182 range as a possible extreme low (near 1200 more likely) and then from there create an extended oversold bounce and volatility for probably 1.5 months into mid to end July 2012. That would then set the stage for the next major leg down into the seasonally weak August September 2012.

Please note that in the chart above the most recent oversold RSI value (top portion of chart) is only a projection and is not based on actual closing values yet. I have created a projection to get an idea of a target zone for the sp500.
The chart above of the sp500 depicts potential guideposts for the sp500 in the weeks ahead. It seems clear to me that the market wants to move down into end of June or the next 10 to 15 trading days into the green shaded circle. Whether it gets there in a day or a few weeks remains to be seen, but I do believe it will get there.
Then after the Greek Election and Fed Meeting it would seem in my current view that the market would be able to sustain some type of extended 1.5 month bounce working off extreme oversold conditions.
Assuming that occurs, it would then set the stage for the next great shorting opportunity as we lead into the seasonally weak August September 2012 time frame.
