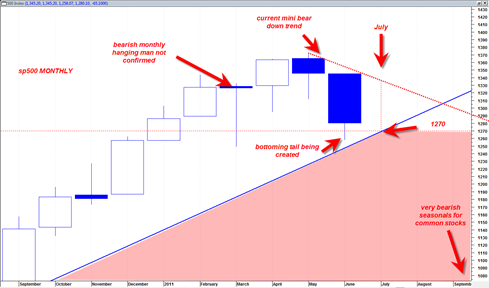
The low in the sp500 for June so far was 1258. Today we had a nice sized rally. With just 3 trading days left in the month of June the market now has the option to create a larger June monthly bottoming tail which shows demand, or continue down the last 3 trading days of June and perhaps even more so into the start of July.
Presently it is looking like the market wants to create more of a bottoming tail for June that could see the market rally into early July.
In the chart below this would create a June monthly candlestick with a longer demand tail and then create greater probability that we could see a rally as high as 1330 which is the top boundary of the current ‘mini bear’.
Assuming that actually does happen, then we could see 1330 hold as bear market resistance leading to a flat to slightly down August 2011 and then maybe a much more meaningful drop in the typically very bearish seasonally September.
The bottom line is that if we do not see the market show more weakness the rest of this week and break under 1267, then it could start to open the door to a move back up to 1330. On the upside 1295 is still a very key level, that if broken topside, could reverse a lot of the near term bearish potential.
The solid blue line in the chart above is the major major up trend line from the March 2009 lows. It is essentially the bull market trend line. It is important to hold for obvious reasons.
Closing under the monthly hanging man candlestick would confirm it, but so far it’s a no go.
1270 is the range that must hold in July 2011 in order for the sp500 to maintain its bullish stance. So if the market can hold ground for 3 more days, then after that 1270 must hold, otherwise it will be trouble in paradise.
But still the problem is the summer doldrums and July and August being typically slow trading months.. that can come into play as well where the market simply does not have enough energy to trade up or down.. perhaps just flat to sideways for a bit more..
P.S. The IWM is looking notably less bearish than the sp500 at this time.
P.P.S. Being purely objective about the above chart tells me that the last two months of down price action is simply the market ‘moving back to trend’. This is not unusual and does not necessarily mean the market has to tank. It simply means market is moving back to trend. The next thing it must decide is if it wants to bust and break that trend, or confirm that trend (by trading higher to 1330 in July 2011).

