There has been a lot of ‘chatter’ lately about how the gold price may be at a major top. I keep looking at the GLD price chart since October of 2010 and have been trying to come to a bearish conclusion but am having a hard time doing so.
It is clear that the GLD has shown a struggling attempt to make new all time highs from the period October 2010 to end of year 2010. The pattern resembles the somewhat common ‘three drives to a top’ pattern that is occasionally seen in stocks and indices. But this topping pattern seems to have failed. During January 2011 we saw the GLD break down, looking like it wanted to confirm the three drives to a top pattern, but then afterwards we saw the GLD take off yet again pushing into life time highs again (into early March 2011) but only for a brief period.
My take is that this most recent push into life time highs again, even though they were only marginal new lifetime highs, should not have occurred if the GLD was in a very bearish pattern.
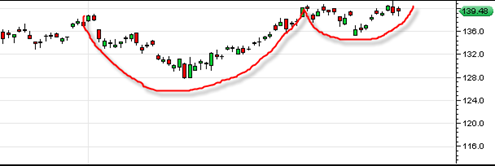
Instead the GLD now appears to have a cup and handle formation with 152 as the projected target (roughly 1520 gold price).
There have also been complaints that the mining stock indices have not been keeping pace with the gold price and thus not confirming a move to new highs. This has been true recently as we have seen the GLD touch new lifetime highs, but mining stock indices such as the GDX ETF not able to do so. But the fact is that the GDX is still within a few percent of its life time highs.
There was also the potential issue of a symmetrical head and shoulders topping pattern from September 2010 to March 2011. This pattern appears to be invalid now.
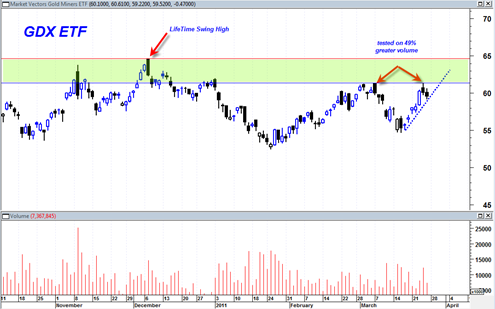
The near term price pattern in the GDX seems to suggest that we will soon see an upside break in the GDX with an eventual attack on the previous life time swing high.
The GDX yesterday tested its previous price swing on 50% greater volume. This to me is a bullish sign and suggests the GDX wants to push up above the key 61.30 range soon. That would then put it in the green shaded area with little resistance and set it up for a move to new life time highs.
Today’s pull back in the GDX was on half the volume of yesterday’s up surge, another bullish sign. I would not be surprised to see a push up above 61.30 next week sometime on the GDX.
This could mean a spark is finally lit under a good portion of mining stocks and maybe even the most speculative exploration miners as well… It might eventually lead to a mining stock ‘frenzy’ of sorts… somewhat of a rarity in this sector…
So in conclusion I have to have a bullish bias on both the mining sector and the gold price right now. If gold was at a major top, I think we would be seeing different trading structures and a much more bearish pattern and outlook for the GDX which does not appear to be the case right now.
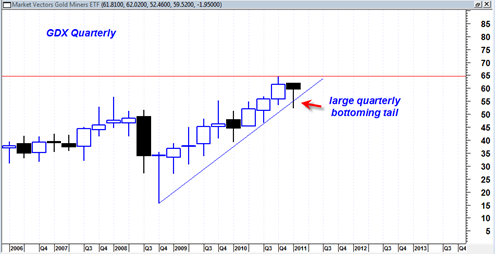
Lastly, take a look at the quarterly GDX candlestick chart:
It shows a very long bottoming tail which shows a rejection of the lower range. The monthly chart also shows a similar looking large reversal hammer candlestick. So both of these seem to confirm demand at the uptrend line.
There are only 4 trading days left in the quarterly candlestick. It is quite possible that the GDX will attempt a breakout going into the end of this quarter and then into the next quarter.


