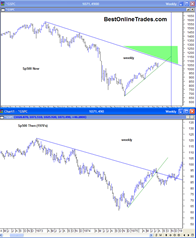
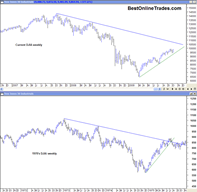
I spent a bit of time again looking at comparison charts over the weekend between the mid 1970’s SP500 and DJIA and our current market.
It really is quite a fascinating series of comparison charts when taken into context of the larger down trend lines that defined the historic bear market. Perhaps the most interesting fact about the mid 1970’s rebound rally was the ability of weekly price in both the SP500 and the DJIA to pierce the longer term down trendline for a period of about 4 weeks. This weakened the long term bear market down trendline and eventually led to a rally higher 6 months later.
The current weekly price charts on both the SP500 and the DJIA continue to show market strength and little mood for a more involved corrective process. The weekly close on the SP500 last week was extremely strong and within only 2 pennies of last weeks high.
It is going to be very interesting to see how/if the current market is able to also pierce the down trendline for a period of weeks and if we also then finally get the correction everyone has been waiting for.
I should point out that the Nasdaq composite has already pierced its longer term bear market down trendline and is leading the way. I think the Nasdaq is hinting about what will come for the SP500 and the DJIA.
I am going to continue to have a bullish bias on this market as long as we continue to hold ABOVE the green up trendlines that you see in the charts above. As long as they are not violated to the downside, there is no reason to panic or get bearish in my opinion. Why fight the tape? It is not worth it. I tried to fight the tape a week ago and it was horrible. I was lucky that the endeavor only lasted a week or so. Don’t fight the tape!
Perhaps one could say that I am keeping the analysis too simple. But I would rather keep the analysis simple rather than try to be a hero and try to pick the exact top early before there is a real signal. A lot of traders are trying to pick the top early and getting repeatedly burned.
Don’t worry, we will eventually get our correction, but there are only 2 and half months left in the year and I can’t think of a better time to start the real correction than on January 1st, 2010. That is just a guess for now, but again the main point is that there is no bear signal until we break these significant green up trendlines. As you can see for both the SP500 and DJIA during the 1975 period, when the uptrend was finally broken it did lead to about 10 initial weeks of heavy downside action that marked the major portion of the corrective process at that time.
It is amazing how complex everyone wants to make the market and get into analysis paralysis. Not me. Not anymore anyway.
By the way, did you notice the action in IBM the last few days? I have a feeling we may see a similar type move in the broad market the rest of this week.


