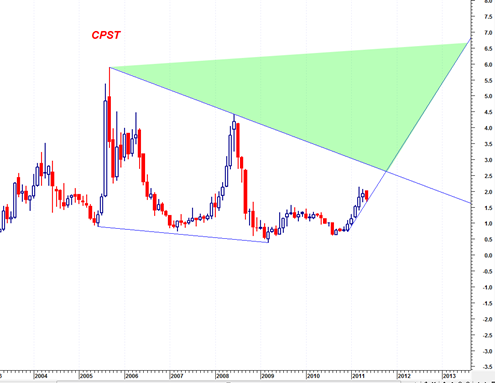
CPST seems to have an nice larger structure and a weekly smooth trend that is somewhat reliable. This low priced alternative energy stock has been trending up for the last 6 months in a steep up trend and has recently been consolidating in a falling wedge for the last 2 months.
It has a nice large resistance structure going back to 2005 and some nice large swing trading ranges. CPST looks like it wants to make a challenge of the 2.5 level and possibly break through to the upside and trade into the green shaded area that would define a breakout in the chart below.
However the stock has had a reputation of collapsing after hitting this long down trend channel line since 2005. So I think it better to assume it will fail up there, but then only give it a second chance if it shows constructive price action near the resistance channel line.
The current price range up to 2.5 is still a nice percentage gain if CPST can manage to hold the currently monthly uptrend. Perhaps it can.

