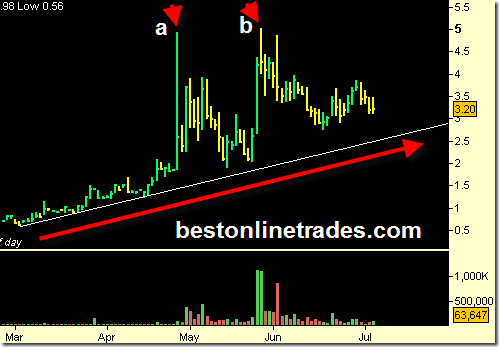
 The chart to the left is the daily chart of JVA – Coffee Holding Company which trades on the AMEX.
Amex stocks can be really spotty stocks in terms of volume, but once in while I have seen some good setups.
There does not appear to be a real setup here as of yet, but I am bringing JVA to your attention because it has shown a few good technical signals that may become more important as time moves on.
For starters you can see clearly from the chart that we have an uptrend that began from the first of March and has progressed steadily to the present. So as long as price remains above this up trendline we can assume that the uptrend remains intact.
Now there is one thing that I need to clarify that is very important with regard to this chart of JVA. That first swing high labeled point ‘a’. For this analysis I need to be sure that it actually hit that high, and that it was not a bad tick (incorrect price data). I have looked at the price on a few different charting programs and they all seem to say that the high on that day was 4.91. So just be aware that this analysis assumes that the price data on that day is correct.
Why is JVA Worth Keeping on the Watch List?
JVA is worth keeping on the watch list because the price swing I have labeled ‘b’ in the price chart above had a swing high of 4.98 and the volume there was 1.1 million shares. In comparison to swing ‘a’ labeled on the chart which had a high of 4.91, we saw a 12X increase in volume. So swing ‘b’ tested swing ‘a’ on 12X greater volume. That says to me that the 4.91 level will eventually be broken to the upside. It was dramatically higher demand on that swing point test.
So the possible setup here (which may take a month to materialize) is that the price of JVA trades sideways to flat or somewhat down on a return to the uptrend line drawn in white. Assuming that JVA will find price support on that white uptrend line, then I would look for JVA to start another rally and eventually attempt a breakout above the 4.91 swing previously mentioned.
So this is more of a setup in waiting right now, as it still has not finished consolidating yet. It may start doing that more pretty soon as the broad market does some more downside correcting.
A key milestone for JVA will be price getting back above the 4.00 level. If it does that then it may be near a buy signal. But for now it is just watch and wait and be patient to fill in the chart a bit more.
Of course all of this analysis will be invalidated if JVA breaks hard below the white uptrend line. I am going to try to revisit this one down the road depending on what JVA price does.
