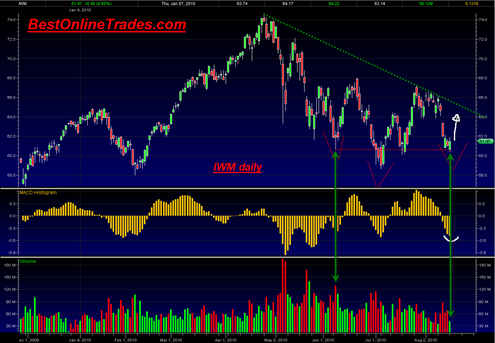
The iShares Russell 2000 Index IWM ETF today had an opening gap down and then a reversal topside for most of the day. The volume today was typically light which is no surprise this time of year.
Today’s action was a pretty typical bottoming type action with the bearish opening gap down and then the full reversal end of day. Today’s candlestick body on several ETFs engulfed last Friday’s small body. On the Dow Jones Industrial Average a pretty convincing looking reversal doji printed on the close.
It is looking like this market once again wants to build another move topside to the top of the swing trading range. It is hesitating down here and at the support of the previous swing trading range bottom on many indices. The total lack of volume today seems to support this case as well.
Today the IWM tested the June 8, 2010 swing low on 61% less volume which is a bullish sign that we go topside again perhaps to fill the large gap at 64.13.
The head and shoulders bottoming formation in the Russell 2000 Index and/or the IWM ETF is still in play as long as we do not break below today’s low.
The weak volume today and especially relative to the previous 6/8/2010 high volume swing low seems to support this case. If we somehow manage to bust down below today’s low later this week I will have to change my tune. But this is looking like yet another swing trading reversal here.
The daily MACD histogram is starting to curl over again but is no where near a bullish confirmed MACD histogram buy signal.
So once again it appears that mutual fund Monday saves the day and we need to watch for signs of a topside move and possible gap fill on the upside. This is one stubborn market trapped in a trading range.
Here is what the head and shoulders bottoming formation looks like drawn in a previous post on the Russell 2000 Index.
The summation index still looks like it is starting to curl over but it is still sitting well above the zero line and sometimes gives false sloppy signals on the turns especially this time of year.

