 The SP500 was down on this Friday the second week of August. But am I surprised? No. Not really. This is about the time that traders head for the beaches. Plus it is starting to get way too hot and humid outside to be sitting in a room in front of the computer all day. So a good bunch of them probably just sold to cash today and headed for the beach or the pool or for their favorite ice chilled beverage of choice.
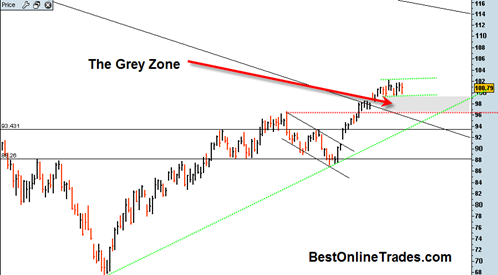
All the bears could manage today was another down day within the smaller green channel I have drawn in the chart. I am still open to the possibility of 95 on the SPY ETF as a normal corrective retracement and testing of the breakout area. It would get us into the ‘grey zone’ so to speak and help correct off some excesses.
The daily MACD indicator is flashing a sell signal, but keep in mind that sideways price movement in that channel for another month can also resolve a daily sell signal in the MACD to neutral again.
Plus as I mentioned the other day, we have a monthly bullish MACD cross that is happening right about now. So the long term trend is up and all systems are go as far as I can tell right now.
The last two weeks in August are probably going to be sideways or slowly labored down type price action.
If you look carefully on the chart, do you see where the horizontal red dotted support line crosses the longer term green dotted uptrend line ? That point may be an ideal pivot point and magnet for the market going into September 2009 time frame. It is an area that defines this entire uptrend and also shows decent support.
We could get there by either potentially drifting sideways, or we might do a nose dive into that point. But regardless of how we get there, the more important point is that we hold that support level.
I actually doubt we will even get there, but if we do then we know the parameters to look out for.
