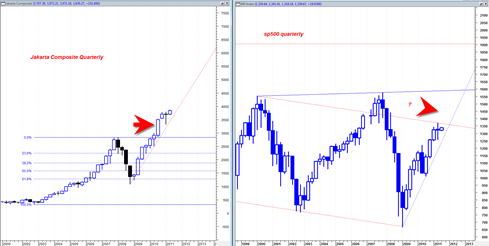
I have posted the chart of the Jakarta Composite before some time ago and I did so because I thought it was eye opening that a market index can do a 62% correction and then blast higher almost non stop going all the way back up to the old high and then blasting out even higher as a breakout to new life time highs.
I suppose the Jakarta index is just showing how this inflationary boom is occurring worldwide.
It is quite fascinating for a market index to have that ability to ‘turn tail’ so quickly.
I am not saying that Indonesia is equivalent to the United States, but it does at least open the mind to the possibility that the DJIA or the sp500 could initiate a similar upside breakout of 10 year channel resistance.
If you look at the quarterly price chart of the Jakarta Composite below you will see that as the price approached the previous all time high it formed a quarterly consolidation hammer candlestick, but then the next quarterly price candlestick was a HUGE HUGE break out candlestick that shot the JKSE to new life time highs.
The current sp500 has also just finished the April 2011 quarter as a consolidation hammer as well right under the 10 year long channel resistance level. So it does make one wonder whether we are about to see an enormous upside quarterly candlestick similar to that which was seen on the JKSE.
By definition and according to Wyckoff trading methodology, in order for a break out to be valid one really does need to see a wide strong candlestick that marks the breakout. Breaking out of a 10 year range seems important enough, so it seems a requirement of this market to make it a valid breakout.
By the way the Jakarta Composite Index projects to about 5200 assuming that index does a 1.618 expansion from the low in 2008.


Dear Tom:
So far our call has been spot on!
A point regarding US equities. In spite of all the haters’ negative and bearish comments,the US still represents the safest place to invest.
Granted we may be in a decline as the World”s Greatest Power, but still if you were in Asia or even Europe and looking for a safe haven for your money, the United States would still be number one!
That said, after what has happened economically abroad, Japan and Europe for example, it is a safe bet that a lot of money is destined to flow into the US stock market.
Couple that as previously commented with the election cycle and the fact that most of the listed corporations are one rolling in cash and two extremely healthy and the conclusion is ineluctable we are in store for a very strong bull market. Perhaps not as profitable as the greedy ones might want, but still a very, very healthy market.
That said, from both the technical and fundamental stand point equities look extremely attractive.
In summation this is no time to be short and probably a hell of a good time to be long!
Again our call has been spot on. See my post of 6/28. See “Back to BOT long”
Tom both you and I have put our money where our mouth has been.
You have taken a lot of criticism, but few have given you the praise you deserve.
Your recent long call is totally and profitably correct!
Congratulation!
Thank you for the nice comments JR. I tend to agree with you. I think we could have a beast of a market on our hands for ‘quite some time’. Will be very interesting to see how it all plays out and when the next major turning points are.
Many Biotech are looking quite strong.. maybe a great sector to focus on for 2nd half 2011.
There was also this massive breadth thrust last week and there is a statistic that is astounding..
Please see this important posting:
http://www.traders-talk.com/mb2/index.php?showtopic=132172
Tom,
well!! I am travelling but something interesting should happen IMO. We should see major top in world markets around this week.
will give reasoning behind my prediction, only if proved right. Have been wrong to predict top around 1300 some months before…
Let us see how it goes this time..
Cheers
Hi Shrihas,
Nice to hear from you again. I would be careful about expecting too much downside from here.. Certainly we could see the market retrace some of the recent 5 day crazy upside rally but it was a enormous sign of strength. I am just saying be careful as the bulls seem to want to stampede again.
On the other hand, I can see how this recent upwards retracement is close to the 78.6% retracement level that can often market turning points in a market and start the initiation of an A B C down type move.. But I am not sure if that is your reasoning. But I mentioned before that Larry Pesavento and maybe some others are looking for the market to drop again from here based partly on the Fibonnacci retracement levels.
But I think the internal signals of the market are telling us the market wants to shoot higher for some time.. it was a very big signal.. It was pointed out here:
http://www.traders-talk.com/mb2/index.php?showtopic=132172
This breadth thrust data is not to be taken lightly in my opinion. The market is trying to tell us something..