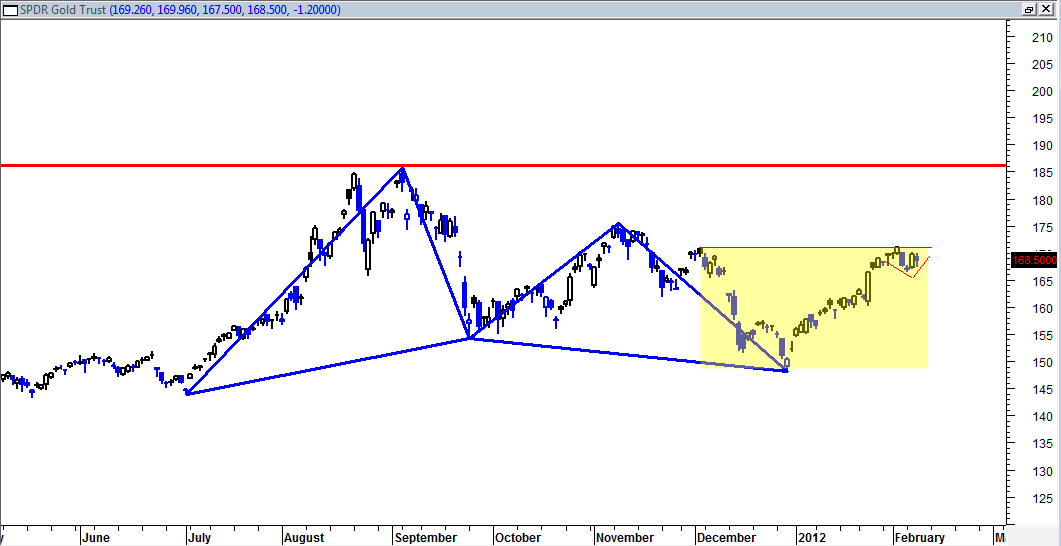
The GLD ETF and the gold price are at a key juncture now. Note in the chart below that we see that the GLD has previously completed a bullish gartley butterfly pattern. The GLD promptly blasted higher the day after this bullish gartley pattern was completed. This is important because the size of the bullish gartley is significant and tells us that an important corrective action has ended.
Also important in the chart is the highlighted yellow area which currently shows a cup and handle tendency on this market with an approximate bullish breakout measurement that points to new all time highs.
The GLD is poised to make a run above the 171 near term resistance and if accomplished will set up some very bullish extended action. We are at a key juncture right now in the GLD.
Note also that the WEEKLY MACD is about to cross on the bullish side which bodes well for the intermediate term bullish continuation scenario.
The gold market continues to perform like a well oiled machine.
Last but not least, note the large price candlestick bullish bar in late January 2012. This is a very important day because it shows a real and true breakout from the last 6 months resistance line. It was a picture perfect valid breakout and again, seems to bode well for a bullish evolution above 171 in the weeks ahead.

