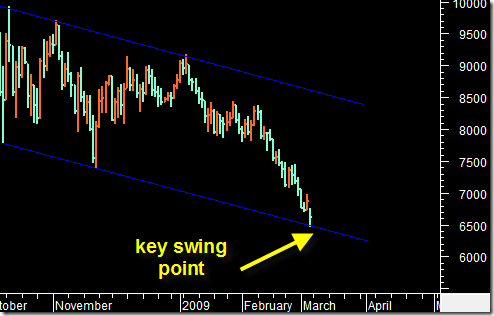
Ahhh, the beauty of swing trading. I believe the Dow Jones Industrial Average bottomed today. Now I could show you a bunch of indicators and oscillators and all sorts of other fancy criteria… but sometimes in life you just need to keep things simple and stick to the basics right?
Well the above chart is pretty basic. It simply shows that the Dow Jones Industrial Average has moved down to the support area of this down trending channel. You have heard me mention before about how extremely oversold this market is. I don’t care how bad the news is, oversold is oversold. So after you get oversold you usually get a good reaction to the upside especially if you are hitting the support of a channel that was hit two times previously.
That we closed up today on a Friday is pretty encouraging. Plus you also still have Larry P’s positive astro aspect that kicks in this weekend. So next week could potentially be a very big up week, perhaps even in a one or two day deal that moves us up 1000 points or more.
Whether or not this is the final low for a long time remains to be seen. I have indicators that will tell me when we are in much safer territory for the longer term. But for now and for the intermediate term we must deal with this channel. As long as we continue to be bound by this channel we will remain in a downtrend. If my predicted really gets going now then we should be looking for high 7000 to very low 8000 area for clues on whether we will break out of this channel and power even higher in a sustained upward phase.
I think a lot of answers will be forthcoming in the next few months that tell us for sure if we are in a 1974 style or 1929 style bear. As I mentioned before I think this will be a 1974 style… and that would mean the upcoming rally could be very large indeed.
