I don’t have a crystal ball that tells me what is in store for the future. But the closest thing to a crystal ball that I have found so far is the 1974 time period of the S&P500. The entire structure of the market during the time frame of 1968 to 1982 has given me a lot of good perspective and understanding about our current market and has helped to give me great clues and better confidence about where our current S&P500 may be headed in the future.
Now you may be asking yourself, what on earth does 1974 have to do with today ? Nothing actually. But what I have found over the years is that sometimes past market movements tend to rhyme and show similar structure and trend development.
I have also found that it can be a big mistake to assume that the current market will play out very closely or similar to what a past market did. That is just usually not the case. And there is also this ‘rule of alternation’ at work that basically says that no two markets play out exactly the same over time. Their patterns and movements may be similar, but chances are they will develop in a different manner to what occurred in the past or at least a slightly different manner.
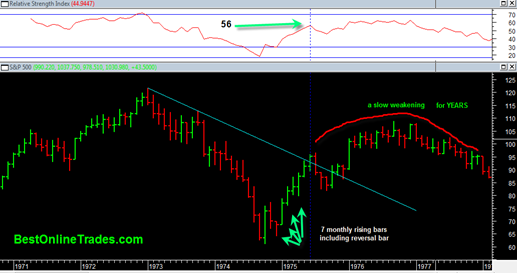
So having said that, lets look at the long term monthly price bar stock chart of the SP500 (click on it to see full size) in the 1970 time frame which is the first chart at the top of this article.
You can see that after the SP500 made its severe market low there was a monthly reversal bar that marked the bottom of the bear market decline and then led to a massive upside rebounding rally.
That rebounding rally lasted for a total of 7 full months (including the monthly reversal bar) until a major corrective phase finally took hold and started at the point of impact with the down trendline which defined the longer term bear market force.
It is interesting to note that the SP500 during that time did a major body blow to the down trendline by blasting up through it initially but then eventually succumbing to its down trend force in the form of a longer correction along the down trendline.
That piercing of the down trend weakened the down trendline and was a hint that it would eventually be busted through topside.
The correction that began after hitting the trendline lasted for 6 full months. After the correction completed the SP500 blasted higher in a huge advance but then turned into a more labored type uptrend. The labored uptrend turned eventually into a slowly arcing advance that became weaker and weaker and eventually turned into another bear market labored type decline.
Now lets look at the current SP500 and see where we are today…
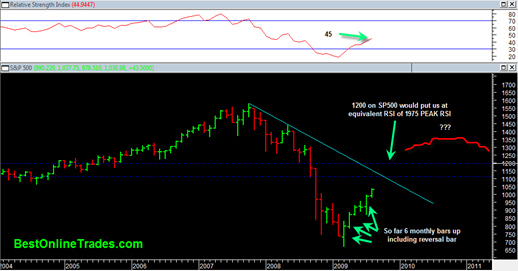
Similar to the 1974 S&P500 you can see that we currently are in a similar massive counter trend bounce that appears to be taking us in almost straight line fashion right up to the down trend force line.
So far we have had 6 full months (if we include the initial monthly reversal bar) of this counter trend bounce. The 1974 bounce lasted for 7 full months before starting a 6 month correction process.
It looks like we may reach that down trendline in the current time frame within the next 1 to 4 months. It is going to be interesting to see if we will be able to bust through the down trendline initially before starting some sort of correction which in all likely hood would last from 3 to 6 months similar to the 1974 period.
There are a few other points I would like to make about the 1974 period chart and the current 2009 SP500 stock chart.
Notice that I have the relative strength index plotted on both charts. The relative strength index is useful for determining oversold extremes, and bear and bull reversal levels in both bull and bear markets.
I can tell you with zero doubt that the relative strength index registered an EXTREME oversold reading in mid 1974 based on the monthly price bars. The reading at the oversold extreme was 18.18. That is extremely oversold.
Guess what the monthly oversold reading was for the current time frame SP500 during February 2009 ? It was 18.34 ! It is quite amazing to me how similar the monthly oversold readings are on the SP500 of then and now.
Another interesting RSI reading during the 1974 period is the RSI peak reading after the 7 month rebound rally ended. That value was 56. After that reading was hit, the SP500 during that time went into a 6 month correction.
Right now our monthly SP500 rebound reading stands at 45. So relative to what the peak reading was in 1975 it says we have more upside on the monthly chart.
Was roughly able to calculate what the SP500 price would have to be in our current market for it to read an RSI value of 56 (the one that marked the peak of the 7 month countertrend rally in 1975). The number comes to 1200 which would have the current Sp500 pierce the down trend line. The sp500 value that would put us right under the bear market trendline is roughly 1110.
So these numbers are just a possible guide based on what happened in the past.
Yes, the Sp500 is overbought right now, but within the context of this counter trend rally and based on past price behavior of the mid 1970’s, I have to come to the conclusion that our current bull run as a long ways to go yet and that we will not enter any 1929 huge down leg any time soon. On the contrary, it is quite possible that we could be looking at another year or two or three of generally advancing prices.
Ultimately it is very possible that the SP500 works its way into 1300 1400 range in a much more labored type advance. At that time however I suspect that the increasing forces of inflation will start to become severe enough to hinder more progress than 1300 to 1400. But that is looking way too far out in time for now.
The talk of us being ‘extremely overbought’ and in need of a correction should be taken in the context of what our market did in the mid 70’s in my opinion. I know a lot of people are trying to pick a top here ( I am guilty of that too), but when we look at the long term picture it helps give us the perspective and confidence we need in the market roadmap ahead of us.
I can’t wait to revisit this post in a year or two or three !!! In fact I might plant a link to this post right at the top of the BestOnlineTrades.com site as a reminder to myself to revisit it so I can see how much or how little egg I will have on my face!


