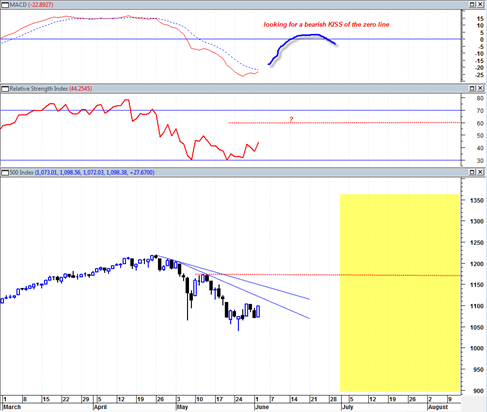
This morning I was looking at the 60 minute 20 day trading chart of the sp500 on Power Etrade Pro. The last hours bar of yesterday (6/1/2010) was a big red down candle and it looked ominous. So when trading started today I began to realize that there was not going to be any downside follow through. Then I also realized that that big down candle was the right shoulder of a head and shoulders bottoming pattern on the 60 minute chart.
So the rest is history and now the market is in full bounce and short covering mode.
This was my original forecast after I identified the Adam and Eve double bottom. But the action of 6/1/2010 was a really confusing head fake because that one day’s price action was enough to turn the daily MACD indicator DOWN and had me thinking we were setting up for total collapse without delay similar to the September 2008 period.
But alas, the market rejected that scenario and is now in full bounce mode off of this Adam and Eve double bottom.
I suspect that the employment report this Friday is going to be good enough to send the market higher and then eventually into the 1150 –1170 range. The key question is how long this will take ?
The MACD is just about to do a bullish cross. Daily RSI is currently at 44. So it would seem we need at least about 10 full trading days to push the daily MACD cross into the bull zone and start it moving towards the zero line.
My take is that once the daily MACD hits the zero line it will FAIL there and do a bearish kiss of that zero line (At that time I will try to confirm this with MACD histogram). Also at that time the RSI will likely be in the 55 to 60 range.
This new overbought level should provide the fuel for a massive catapult and crash into the July August 2010 time frame.
If the daily MACD hits the zero line and fails there AND we see a confirmed sign of weakness in the SP500, it will signal that the crash leg is underway. And if this occurs and everything is confirmed then I expect price to lose support rapidly and relentlessly without many pauses in between.
This would be a very similar setup to the 87 crash in terms of the technicals. The open question is how long the bounce will last and if it will even extend beyond 1170. But to be honest I really do not care how long the bounce is. I will use the previously mentioned indicators as my guide for the turn signal when/if it comes.
This market trading range during the last week or so has been somewhat frustrating, but I suppose that is what the markets job is. Now it wants to clean out all the bears and squeeze them out of all their positions for a week or two. That squeeze may be quite powerful and I would not be too surprised to see the market briefly peek above the 1170 level for a few days.
So it seems that the best clean trade is to wait for this moment when the current bounce transitions and then rolls over again. Because it should lead to a really nasty fierce decline that punches right through the May 6, 2010 lows and then continues down more into July August 2010.
Since we are in June now, that really only leaves us roughly 50 full trading days until the mid August time frame. So it would seem like 10 to 15 trading days up would be enough to get the indicators in the proper stance for the next shorting signal.

