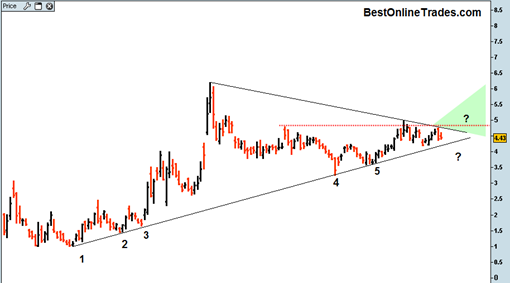
HBAN is nearing a decision point after a somewhat lengthy uptrend since March of this year and a few intermittent spike rallies. HBAN has a somewhat similar setup to the FITB setup that I had written about in the past.
HBAN has been consolidating between roughly the 3.5 and 5 level for several months now and has already touched the bottom up trendline 5 times giving it good significance.
I cannot speak as to whether HBAN will be able to get an upside move off of this structure into the green shaded area. Typically the market in general is vulnerable this time of year to some downside shakeouts. But so far the broad market is holding up like a champ. The retracements have been intraday retracement and not significant corrections.
I suppose one could make the case that the HBAN chart is also showing a head and shoulders topping pattern (not drawn in) with the up trendline serving as the neckline of the pattern.
That could be a valid interpretation, but the uptrend bullish continuation interpretation could be equally as valid.
I am looking for HBAN to get to 4.70 or higher as an indication that a new up leg could ensue.
HBAN from the March lows has had a huge run and all this sideways price action since then has been generally constructive and helped to work off the energy of that run.
So lets see if HBAN can deliver.
I am thinking a decision point should come no later than 5 to 10 trading days from now.

