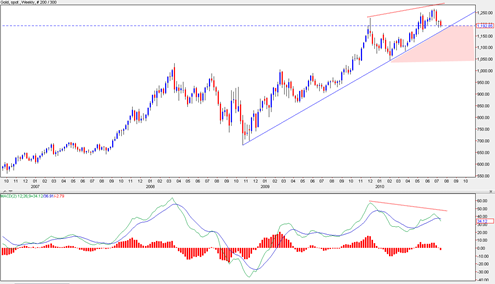
The gold price is still in a precarious position right now and looks like it is set for more weakness in the weeks (and maybe months) ahead. There continues to be this bearish weekly divergence between MACD and weekly price.
If we continue to break down we will then also be at risk of breaking an important uptrend line in the gold price in force since September 2008, a significant period of time.
If we break this uptrendline we are likely to also eventually create a monthly MACD sell signal which would have strong bearish implications for the rest of this year. We currently have a bearish ‘triple M’ on the monthly MACD histogram. It is as of now still unconfirmed and we will need August monthly closing price as confirmation that the monthly trend is in a new down mode.
Ignoring bearish divergences is usually never a good idea.
It is true that the uptrend line since September 2008 is not yet violated however the weekly bearish divergence is unlikely to change its momentum at this time. I also see bearish volume characteristics on the daily and weekly GLD ETF chart.
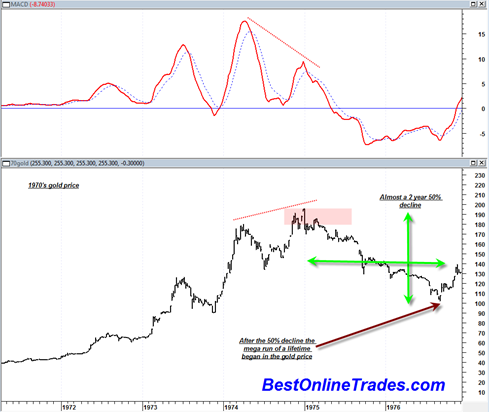
If you look at the peak that occurred during the mid 1970’s in the gold price you can see that it also made a new marginal high followed by a break down, then a slow drifting down and then new momentum to the downside.
The mid 1970’s also had a weekly class C bearish divergence just like the current weekly spot gold market does. Even though a class C weekly bearish divergence formed in the mid 1970’s the gold market at that time took a long time before it really started to break down. I suspect that will also be the case in the current time frame. The gold price will likely drift only slightly lower for the rest of 2010 having the appearance of a slowly weakening trend instead of a real collapse.
If the long blue uptrendline in the current 2009 2010 time frame somehow manages to hold then I will have to re evaluate but for now I think the bearish stance on the gold market is the correct one.


