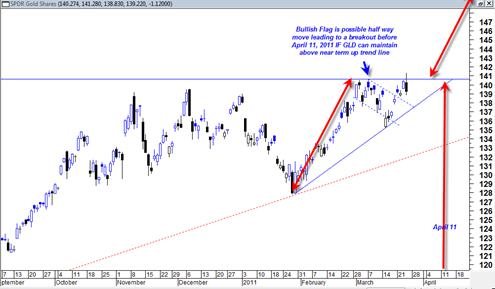
Today the gold price ETF and the spot gold price rallied up to life time highs but then sold off end of day to settle and close under yesterday’s low. I have seen this type of action before on the gold price as it attempts to break out to new all time highs.
At this point I do not believe the head fake. I think ‘they’ are trying to create the illusion that this was a reversal sell off and important rejection of the highs to be followed by another leg down. I think if they had closed the GLD ETF down much more, perhaps 2% or more it would have made a much more dramatic statement.
Instead, we see that the GLD pushed to new life time highs and tested two important price swings in early March on equal or greater volume, a positive sign.
After hours the GLD bumped up quite a bit, moderating the potential short term bearish looking candlestick. But again, it is only moderately bearish to me. I think today is a head fake to sooth the gold top calling crowd.
One mental trick to use when viewing intra day price reversals like we see in the GLD today is to see how negative a close occurs relative to the previous day’s candlestick. In some cases one can see a strong intra day reversal and yet the close did not even manage to get under the previous day’s high. In my experience those reversals are usually just consolidations rather than all out bearish trend changes.
If the GLD is still strongly bullish then today is simple a head fake at the 52 week highs that may evolve into a minor consolidation but then eventual breakout again before April 11, 2011.
There also appears to be a bullish flag formation in the chart above and then we could extrapolate and say this flag formation is the mid point of the eventual follow on move. As long as we maintain the near term blue up trend line, then it can be said the GLD has another (few) shots at a life time breakout.
Marty Armstrong did some great analysis of the gold price earlier this month and my take from his analysis is that he prefers to see the gold price move into a low by mid June 2011 (June 13, 2011) as it would then create support for this market to rally much higher for another few years. He seems to much less prefer the gold price moving into mid June 2011 as a high and especially a spike high as it could lead to a phase transition for this market that leads to a 2 to 3 year decline phase. It is an interesting analysis and there is a great chart with channel lines in his report.
It does appear quite clear that mid June 2011 (June 13, 2011) is going to be a key time frame to watch in the metals markets (both gold and silver), especially if they are surging in parabolic vertical fashion into that date.
That date will also probably be key to watch as it relates to the equity markets as well as they appear also in the mood to keep charging high soon to new 52 week highs…

