BestOnlineTrades is issuing this blockbuster trade alert on the gold sector. Whether it be Gold Futures, Gold ETFS (such as the GLD or DGP ETF), micro cap through large cap gold stocks, or even long dated call options, we believe the gold trade will be the most popular and productive trade for the next 9 to 12 months.
This is a very important alert and we feel that this alert may go down in history as being the most valuable and important alert we have ever issued.
BestOnlineTrades has studied the gold market carefully since 2003. We have seen and recognized the beginnings of this bull market at that time and feel that right now, perhaps even as soon as this week the gold trade will activate and turn into one of the biggest breakouts the world has ever seen. It may not seem like a breakout at first, and it may disguise itself by transforming into a ‘slow motion’ breakout, but we believe it will still be seen in hindsight as being transformational.
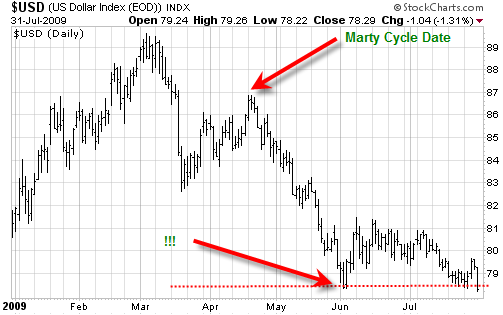
While we do not talk too much about fundamentals here at BestOnlineTrades, we remain open to the possibility that inflationary trends will start to become more entrenched and severe during the next 9 to 12 months. Part of the reason for this observation has to do with the fact that the US Dollar Index precisely aligned and topped with the April 21st, 2009 Marty Armstrong Cycle date precisely. The Marty Armstrong Cycle is a very powerful 8.6 year global business cycle model that has proven itself to pick extremely important turning points in major markets worldwide. The fact that the US Dollar has aligned itself to the model is an event in our opinion that is not to be taken lightly.
Indeed, when we look at the most recent action on the US Dollar Index we see that after trying to form a minor double bottom from a slight bullish divergence, the US Dollar failed on July 31st to show positive follow.

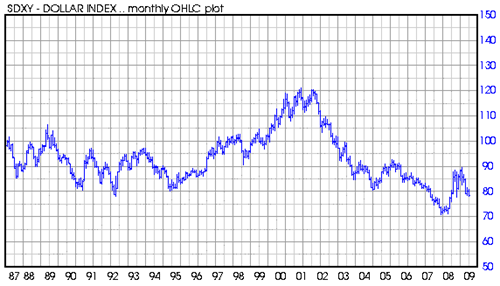
Instead there was a nasty price reversal on Friday showing a ‘sign of weakness’ that now risks breaking below critical longer term support at 78. This is critical longer term support because it represents almost 20 years of price support.

If broken, we see it signaling a move to 70 as a first target. We have written about the US Dollar index before and said that 100% retracements are not that uncommon after initial major bear market bottoms. It is starting to look like the US dollar may do a 100% retracement of its entire bear market rally that occurred during 2008-2009 from the 70 to 90 level.
We have also noticed several very powerful signals on the long term gold price chart. Lets outline in bullet form the key factors we have observed and anticipate.
- The quarterly price bar chart for gold futures shows we currently have a ‘double inside quarter’ price pattern which is rare and indicative of big price breakouts. Snce the bull market in gold began in 2001 we have only seen one other ‘double inside quarter’ which occurred in the quarter ending June 2005. That pattern led to 1 full year of very persistent upward price appreciation.
- The gold price since March 2008 has formed an inverse head and shoulders pattern with solid symmetry both in terms of price and time. Each shoulder runs approximately 6 months and is indicating that a breakout in the gold price is imminent.
- The entire inverse head and shoulders pattern mentioned in the previous bullet point is actually the handle of a much much larger cup and handle pattern that started formation in 1980. So we are talking about a cup and handle pattern of almost 30 years in duration.
- The cup and handle pattern has price measurement implications of 1400 to 1800 gold price target. The 1400 price target takes into account the statistical 50% success rate of cup and handle patterns meeting their price targets.
So we believe this upcoming move in the gold price will be from 3 to 4 quarters in duration the final price portion being the most persistent, most speculative and most ‘feverish’.
We believe one of the best ways to play this move is with the DGP ETF (DB Gold double long) which on July 31st, 2009 was trading at 20.67. The more supercharged way to play the impending move in gold is with 6 to 9 month GLD ETF Call options. Either the 100 GLD January 2010 Calls (currently priced at 4.00 ) looks ideal at this point.
Gold stocks also look poised to make a very large run along side significant strength in the gold price. We recommend treading more carefully in the gold stock sector because of specific stock risk and country risk, however overall we do expect them to do well. The GDX ETF is the diversified way to play gold stocks.
We are now into August and while seasonally the last half of September is statistically the most advantageous to the gold price, we would not be surprised to see a march upwards before that time frame.
Like most other markets, the gold market has managed to ‘put everyone to sleep’ during its consolidation that began in March 2008. We have learned that the best time to become most attentive to any market is during this low volatility, low interest time frame which appears to be nearing an end soon.
We will issue a follow up on this alert in the months ahead.

should there be an oil alert as well with gold?
Well the blockbuster oil alert really existed when oil was at 35 to 40 on the chart. Since then it has had a huge run and the outlook is a bit more complicated. I will try to make some new comments about oil soon. Thank you for your comment.