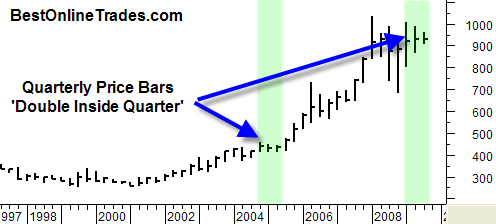
The chart you are looking at here is the quarterly price bar chart for the continuous gold contract. I love long term charts like quarterlies because they forecast bull market moves and are definitely geared towards longer term forecasts. This gold futures chart is no exception.
Something very significant has developed in the gold price on the quarterly chart. For the first time since 2004 (that was a long time ago!) we see a double inside quarter developing. A double inside quarter exists when the two most recent price bars each have lower highs and higher lows than the preceding price bar. It is similar to a ‘coiled spring’ in that you have price compression. These ‘double inside’ patterns do not really forecast price direction either up or down, so we could see a big move up and out of this pattern, or down and out of the pattern.
The Previous Pattern Resulted in 1 Year of Upside!
Indeed, the last time we saw one of these double inside quarters, the gold price advanced upwards for 4 straight quarters in a row, or close to 1 full year. That shows the power of this pattern and the internal energy it is capable of building especially on the longer term charts.
So which way is price going to break out this time around?
I don’t know. But I do know that right now the US Dollar Index is bouncing up off of a minor double bottom and a minor bullish divergence. That should put some pressure on the gold price shorter term. In my opinion it is going to be important to keep an eye on the USD into August to get an idea whether the dollar fails again, or creates a different pattern.
Seasonally, the last half of September is the most bullish environment for the gold market and pretty bearish for the dollar index. So maybe the dollar gets a low volume bounce in August, only to fail again in September? That is just a little early speculation on my part, but we need to see more price work to make any more conclusions.
