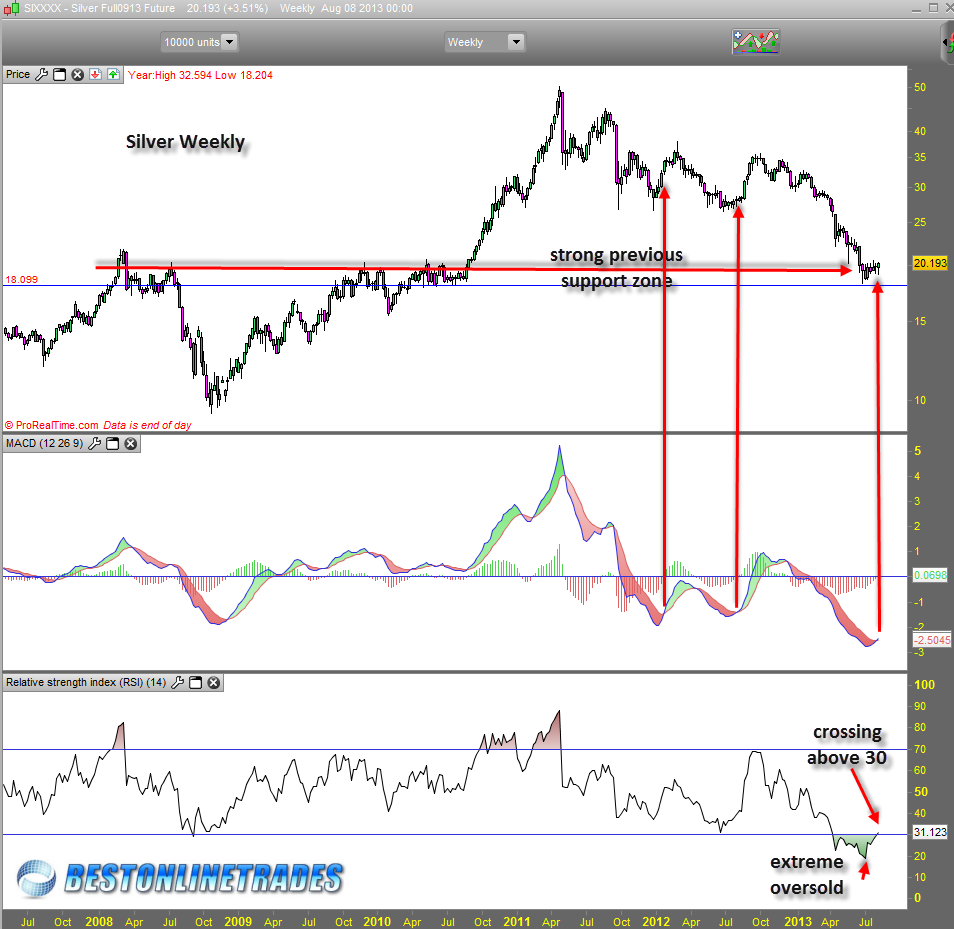
I have been researching the gold and silver sector today and I am slowly coming to the conclusion that this sector has a very good chance of mounting a sizable upside bounce (swing trade) from what seems like the bear market from hell. To be sure, precious metals sentiment has been extremely bearish and at a record bearish level as compared to the 2008 bottom in gold. It is also true that the gold commercial traders are at a historically very bullish stance right now.
I have this sense right now that we are about to see a shift of sorts in momentum in both the equity markets and the precious metals sector. I am basing this on a careful examination of the equity index charts, the precious metals charts, and the fact that we just hit the August 7th, 2013 PEI cycle date.
So far at least the sp500 has barely moved to the downside and one has to wonder whether or not the bears can get the job done. But that is usually how tops are created in the indices. They take time and they make everyone confused about whether we are at a top or not. A top takes time to form and is slow at first until there is that one decisive crack in the market that changes the tone. I could be wrong about the sp500 being near a top, but that does not necessarily mean that the precious metals can’t stage a sizable upside bounce. We will just have to see whether the sp500 weakens more as we complete August and move into the weak September seasonal setup.
Lets look at the internals of the market:
WEEKLY nasdaq Summation index plus stochastics
PUT CALL 10 Day Moving Average
Each of the links above show a market that is getting slightly weaker internally and is poised for a possible trend change. The moving averages of the summation index are starting to descend rapidly. The weekly nasdaq summation index stochastics show a possible trend change. The sp500 bullish percent index moving averages are about to curl over down. The 10 day moving average of the put/call ratio is in a complacent zone.
In addition on the monthly chart of each of the indices (DJIA, Sp500 and Nasdaq), we see that RSI is making what looks like an ‘M’ pattern which was the same pattern that existed at the top in 2007.
The bottom line is that we need to see the market start to push higher soon and make new highs during the next two weeks or traders are going to start to wonder whether the market has enough staying power for another leg higher. OR instead that it needs a correction to finish August 2013 and create a monthly price bar reversal.
Personally I think the August 7, 2013 turn point date still has a good shot at calling the turn in the market indices, but we will have a better idea as the next few weeks unfold.
So back to gold and silver now.
I am open to the idea that gold and silver have bottomed on the August 7, 2013 turn cycle date. The charts seem to be hinting at this fact whether we look at the weekly or monthly charts.
The monthly chart of GLD and SLV show potential candlestick reversal patterns. For GLD it would be a piercing pattern and for SLV it would be a bullish harami.

I am thinking about going long either the UGLD or the USLV which are the triple leveraged versions of the GLD and SLV respectively. Of course timing is everything with leveraged ETFs and so for a multi week swing trade in such ETFS you really need to get the change in trend almost to the penny. Some mining stocks such as AG may also be good or even the triple leveraged mining ETF NUGT. But honestly probably the bets way to play the possible bounce in the metals is the UGLD. Silver is usually late in joining the rally and the mining shares are often slow as well and sometimes suffer more from broad market equity weakness.
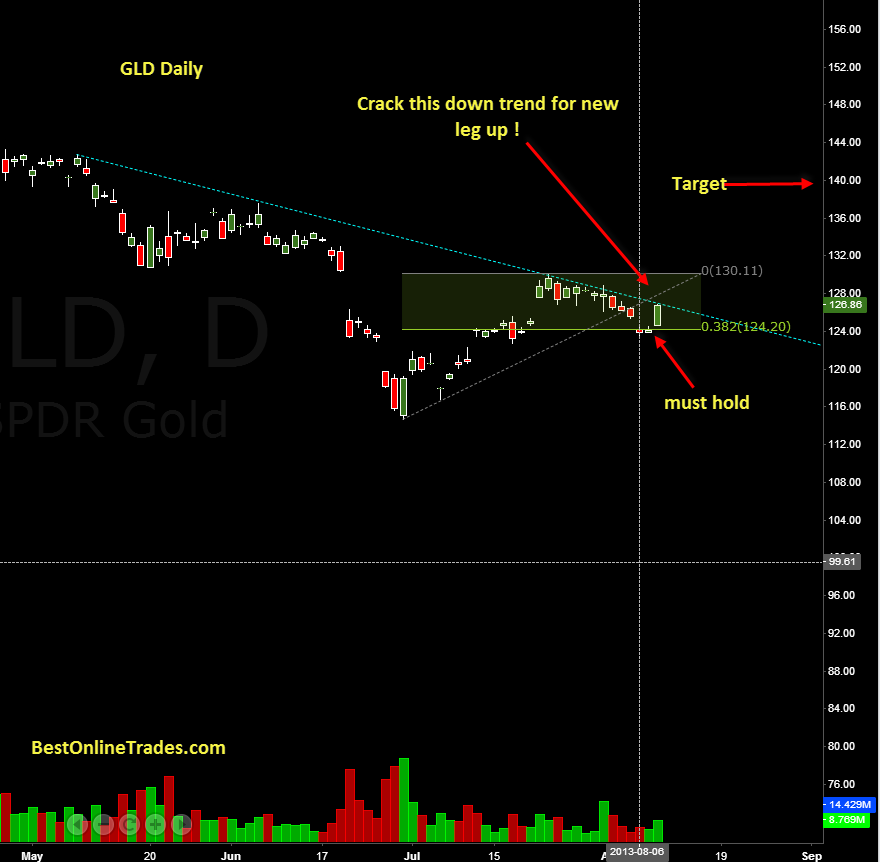
If we look at the chart of the GLD ETF we see that the GLD has staged a decent rally recently but still finds itself under down trending resistance. It is also true that the GLD has recently retraced back a .382 Fibonacci level and so the GLD must not break below this Fib level in order for us to believe that a new rally is about to commence.
The Fib .382 retrace level that must hold is 124.20. If we break under that, then this bottom call is wrong.

You can see from the chart above that GLD is in an ideal position to take the opportunity to bust north from the down trend after having done a .382 Fib Retracement back down to 124.20.
The US Dollar index has been very weak as of late and is in a position now where if it does not rally strong very soon, then it would but in doubt the entire uptrend that began in May 2011. It will not help the dollar much from a seasonal perspective either as September to December is traditionally very weak. The weekly MACD on the US dollar index is about to curl over to the downside and a KEY violation could occur within the next 1 to 3 months.
Of course the opposite seasonality is true for the metals. August to December is traditionally strong for the metals and especially September. The excess bearishness of the metals in recent times has maybe to a degree negated the strong seasonal effect but I would not bet on the September seasonal failing this time around, especially when we consider the current bullish setup of the charts.
This is going to be very interesting to see how this all shakes out. If I am correct then we will see equity markets get slammed down and gold and silver spike up for at least 1 to 3 months. Everything appears lined up for it whether it be sentiment or the August 7, 2013 cycle turning point date. So now the only thing one can really do is just study the daily tape carefully to see signs of more failure ( in equities ) and signs of more strength in the metals.
