You probably just read my previous post on the US Dollar index where I talked about how the dollar really needs to stay below that funny blue looking line to keep it in a near term bear trend.
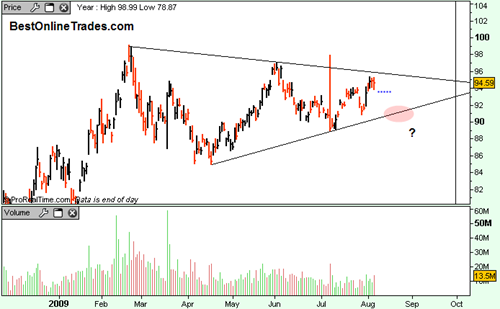
But now we are looking at the GLD ETF which is in a sideways triangle. Triangles can be a real pain because volume gets really light as price compresses into the triangle. I am starting to think that the GLD ETF is going to make another trip to the bottom boundary of this triangle near the red shaded circle on the chart.
The problem I am having right now with GLD is that we are about 3/4 of the way through this symmetrical triangle. Ideally you want to see price make a breakout move no more than 3/4 of the way through a triangle because there can be a weakening effect to any breakout if price extends out too far into the apex.
Perhaps I am splitting hairs, but these are the parameters that are being served up to us right now. If the US Dollar gets a bounce going into the 81 level it may push the GLD ETF down near that red circle.
IF that happens then what I would want to see is a failure of the US Dollar right at resistance, and a sharp upside reaction in the GLD ETF off of the bottom support of this triangle.
But How Often do we Get What we Wish For?
Not that often unfortunately. But these are the parameters I am looking at in GLD right now and we will have to see how they shake out in the weeks ahead.
Triangles can be extremely tricky and dangerous too.
You see, the problem is that an orderly normal upside breakout in the GLD above and out of this triangle just seems too easy, too predictable. If we try to get inside the mind of the ‘all knowing market forces’, we might conclude that the first thing they would want to do is slam down and through the bottom of this triangle, but only briefly, thereby taking out all the hopeful longs, and then quickly reversing back up inside the pattern into the apex again, and THEN do a real upside breakout into the 100 range. That is the most deviant scenario I can come up with. Whether it happens or not remains to be seen.
A lot of what happens will be related to how the US Dollar behaves as I was talking about earlier.
Jake Berstein, the seasonal expert on all commodities says that seasonal lows for gold come due in late August. That sounds about right to me based on the 30 years seasonal charts I have seen for gold.
So to sum up there are many things at play here. The US dollar moving back up to down trend resistance. Gold sliding to bottom of triangle. And strong gold seasonality by end of August. That is a lot to chew on, but I hope all of it is resolved within the next few weeks.

