Apple Inc. makes up quite a large percentage of the QQQQ ETF and makes it hard for the QQQQ or Nasdaq to outperform if AAPL is trading extra weak on any given day. This is what appeared to be happening last Friday 3/18/2011. Apple was trading weak for a good portion of the day and it did not allow the Nasdaq or QQQ ETF to get as much bounce as several other popular indices.
Apple Inc. without a doubt has been the ‘lead sled dog’ in the huge market run up since 3/ 2009. It has been the ultimate momentum stock and trading machine. A lot of traders have expressed the thought that there really cannot be any market top or major correction unless the big Apple falls from grace. This has proven to be very true since 3/ 2009.
Apple seems to have been the ‘bubble stock’ that everyone looked towards for leadership. The literal obsession with iphones and ipads reminds me of the internet euphoria of the 2000 era.
But now there seem to be some headwinds for Apple Inc. Inflation is starting to surge. Crude oil is spiking higher. Competition is heavy and increasing. And Steve Jobs does not appear to be ready to return to run the company any time soon. Could it be that AAPL is at an juncture where growth is going to start to slow down slightly? If this holds true then it would seem reasonable for the stock to take some what of a breather and head into a trading range again.
I watched the tape action on AAPL quite closely last Friday 3/18/11 and it was notably weak. But I already said in a previous post that every time I have seen this weak formation near support, somehow AAPL has risen from the dead the following weak and managed to trade higher again by some miracle without getting a more serious correction going.
The action looked very similar to 1/21/2011 when AAPL also closed on its lows and looked like it was about to break down badly. Instead it went almost straight up the following day and never looked back.
So it will definitely be interesting to see what the verdict is next week on AAPL. Surely if AAPL breaks down from here, then I just do not see the rest of the market surging higher either.
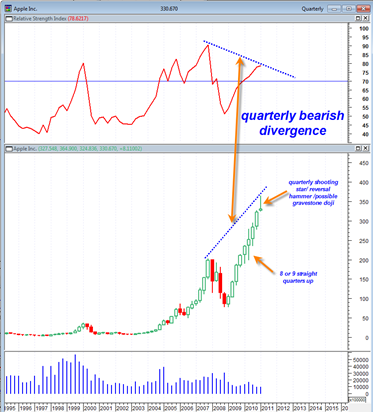
The quarterly price chart of AAPL shows that AAPL has achieved almost 9 straight rising quarterly candlesticks in a row. This is an astonishing feat but from a probability standpoint makes one now wonder if we are overdue for at least just one down quarter to change the stats.
Indeed, the current quarterly price candlestick is showing a similar potential very bearish looking shooting star candlestick or even a possible gravestone doji depending on how the last 9 trading days of March 2011 resolve.
This very large topping tail has the potential to be very bearish because it shows significant supply coming into the stock on a quarterly basis. Quarterly candlesticks have time implications of at least the next quarter, so we are talking about 3 months or more of down or corrective price action for AAPL.
The quarterly shooting star candlestick on AAPL is not confirmed yet. We need a close under the low of this candlestick to confirm it. It will almost take a miracle for AAPL to evade this bearish quarterly candlestick during the next 9 trading days. Certainly in this market anything is possible in 9 trading days, but it seems highly unlikely.
In addition to the large shooting star candlestick, AAPL is also showing a large bearish divergence between quarterly RSI and price. This means that if the shooting star candlestick is confirmed then we are likely going to see the bearish divergence confirmed as well.
I really do not know if AAPl will be able to start its decline before the end of March. It could, similar to the way Netflix NFLX has done. If it does then we will start to see the candlestick form a body that starts to retrace into the previous quarter’s candlestick body.
What about the QQQ?
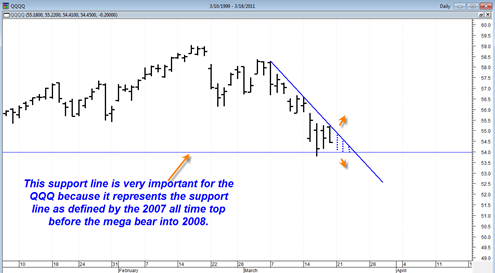
One can clearly see by looking at the QQQ chart that there is not much room left to decide whether this ETF will break its down trend this up coming week or break down and through 2007 support line.
I do not think it should take more than 2 trading days for the QQQ to decide what it wants to do. I wish I knew exactly what it wants to do. The bias seems to be for a downside break, but the market has had a habit of rising back up from the dead so I have to be careful about making too firm a conviction for now.
A break below the horizontal blue line in the chart above would quite strongly help to support the bearish conviction in my opinion.
By the way, the quarterly price chart of the QQQ is showing the same potential bearish quarterly shooting star candlestick that is forming right above the 2007 all time top. So if we do break back down below the blue horizontal line in the chart above it has the potential to be very bearish longer term indeed…
The only way I can see all the bearish potential above eliminated is if we somehow get a 9 day surge into the end of March. I have been surprised before by this market so I cannot rule it out… It would truly be an amazing feat if the market can pull it off once again and evade all the bearish signals… I doubt it can, but the next 9 days should tell the tale…


