The US Dollar got clobbered today and gold popped up like a basketball submerged under water. So far the supposed US Dollar rally is not materializing. The dollar is trying to rally but it cannot seem to get any real ease of movement to the upside. It still could, but it had better start soon because it is once again flirting with the critical longer term support line. The price action today in the dollar looked like a real sign of weakness to me.
Meanwhile the gold price is inching closer and closer to the completion of its symmetrical triangle formation and I am slowly gaining more and more confidence that we are going to see a real breakout from this market come beginning of September.
The dollar index just keeps failing to get a rally going and I am thinking if it keeps failing like this for the rest of August it might turn into a real severe drop in September. If that scenario plays out then it would help the gold price to finally get an upside breakout above the 1000 range.
Incidentally, if I am correct that we do get a gold price breakout, it will be important that the breakout materializes in the form of wide price spread and blockbuster volume on the upside. We will have to take a look at the GLD ETF to get confirmation.
I still think this gold price setup has the potential to be one of the greatest upside setups I have ever seen in my life if I am correct on us getting an upside break.
21.70 on the DGP ETF ( The gold double long ETF ) is for me the green light signal that the breakout has started to initiate. The “safer” upside trigger on the DGP ETF is 23.75 or above.
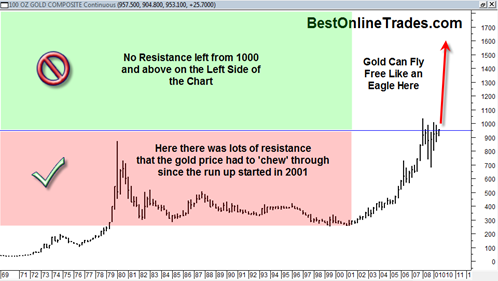
I don’t mean to dramatize this setup too much, but how often do you see a 30 year cup and handle pattern with a 1.5 year head and shoulders bottom formation that makes up the handle perhaps only a couple weeks and change from one of the greatest breakouts of all time? Not very often.
If we do get the breakout, then I would expect the price move from the activated price points I indicated above to last anywhere from 6 to 9 months. So we are talking a possible massive slow motion trend trade here. I cannot see the entirety of this move being any shorter than 6 months based on how I have seen the gold price behave in previous breakouts.
I really think we are getting close! And I would say that the gold price breaking above 1000 is about as significant an event as when the Dow Jones Industrial Average broke 1000 way back in the early 1980’s.
Part of the reason why this potential upside breakout in the gold price could be so exciting is because there is no resistance left on the left side of the chart. Click on chart to see full size.
That means that if we breakout North, that the gold price can fly free like an eagle without much to stop it from running hard and fast. Fast price movement is a relative term. What I mean is that the price could run higher a lot faster than it has during the previous 7 or 8 years.
And remember that it is typical for the BEST upside in any bull market to occur during the LAST 10 % of the move. So the first 90% of the price move is the labored upside that is still good, but it is only the last 10% of the move that delivers the most aggressive returns.
If the gold price behaves in this manner then it could mean we will see something akin to a vertical style price movement. Or at least more vertical than it has ever persisted before.
Stay tuned!

