The rest of this week is pretty much a non event as far as the market goes. Volume has dried up to almost nothing in recent days which of course is no surprise given the holiday week we have this week and the half day of trading on Thursday.
I still think this market is within a 1 week window of a significant top at these levels. If the market is up very significantly the next two trading days and/or the last 4 trading days of the year next week, then I am probably wrong about this being a top.
However, if we are down tomorrow and either flat or down on Thursday, then we may be set up for a nasty plunge sometime next week or end of next week. That is how all my charts are set up.
The Bollinger bands on the major indices are extremely tight right now which makes sense given the tight trading range we have been in for about a month. Volatility is at record lows as well. At some point the Bollinger bands are going to start expanding and create a new volatility trend. It could be either up or down, but my take is that it will be down and possibly fast and furious down.
But again to keep that scenario intact, we really need to be flat to down tomorrow and Thursday or only very marginally up.
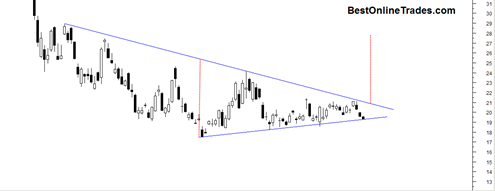
This would correlate to the FAZ ETF holding the bottom support of this large triangle pattern it has been in. I would like to see it hold the bottom support of that triangle and then get an upside breakout next week or end of week.
So there are a lot of “ifs” in the paragraphs above but that is just the way it goes. Those are the things I need and want to see to keep the corrective scenario intact.
These end of year changeovers have at least the potential to be significant psychological turning points. The Nikkei in 1989 rallied really hard right up to December 31st 1989 in almost vertical fashion but then on the 1st of January 1990 it started a massive plunge and the previous highs have not been seen for about 2 decades so far.
So wouldn’t that be interesting to see this market drift randomly right up to December 31st 2009, and then come January 1st, see it move hard down in relentless fashion?
The setup for it to occur that way is there. But again, we need to see these supports and resistances hold the market into that kind of scenario if that is the way it is going to play out.
The US dollar index is skyrocketing higher and the gold price is plunging. Bonds are also selling off pretty quickly. So the action in these three markets would seem to suggest that the stock market needs to play catch up to the downside to compensate for the messages that these leading indicators are sending to us.
I still think that the tri star doji pattern that occurred in the SPY in mid December is still valid. We won’t know that until a couple weeks from now, but the tri star doji that occurred in the UUP also had some minor market action that traded slightly above the pattern briefly, only to see price collapse right after that.
So understandable the market will be on PAUSE mode rest of this week and probably early next week as well. As long as the market is contained within this current range and trades only very slightly up to flat, then I am still optimistic for bears to finally be vindicated. If however we just keep ‘gapping and going’ the next 6 or 7 trading days then this scenario analysis could be completely wrong.
So crossing fingers here for the market to cooperate with me and you as well 🙂 .

