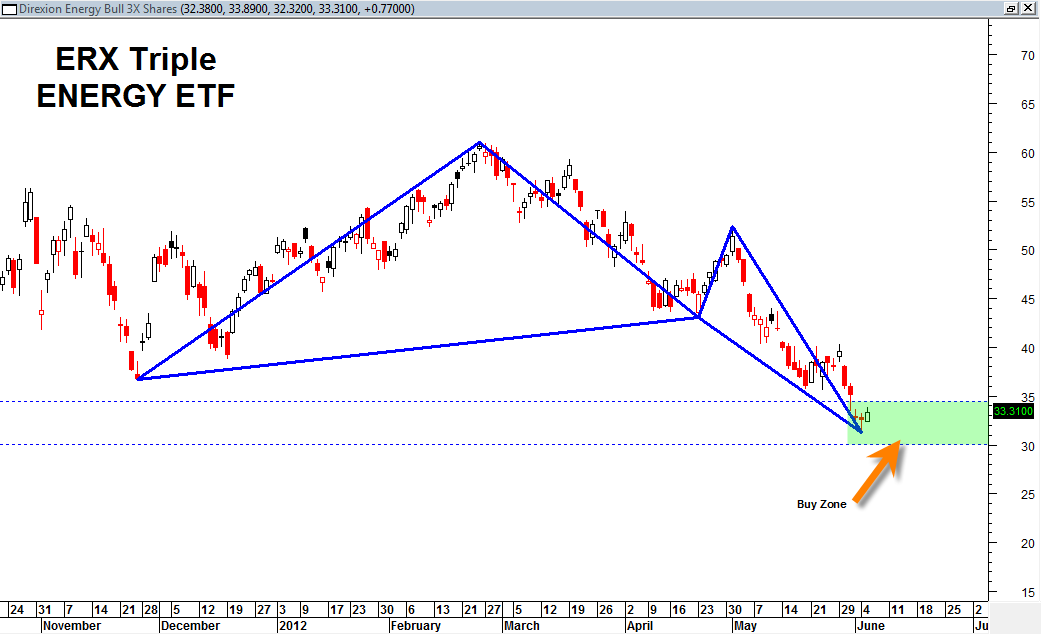
The ERX Triple Energy ETF looks like it is almost done completing an important bullish butterfly pattern. If the pattern is valid then we should see price showing final bottom action right now between the 30.06 and 34.42 range.
Price on June 5th, 2012 has shown a small bullish engulfing of a previous bullish hammer candlestick.
That could be enough of a signal to suggest this ETF has bottomed at this juncture.
Only a breaking below 30.06 would suggest to me this pattern is not valid.

Incidentally I am seeing a decent number of butterfly bottoming patterns. I am also seeing a bullish butterfly bottoming pattern develop and complete in the IYT ETF (Transportation Index ETF).
In my previous sp500 index update posting I suggested we could be setting up for bullish price action the rest of this week as there are some bullish divergences. The bullish divergences if they are able to carry through could send prices persistently higher from here. That is the nature of the current short term bullish divergence.
Combine that with the bottoming butterfly patterns in the ERX and IYT, we are setting up a potential scenario of this being the final low for the markets. In other words I am becoming open to at least the possibility that we may have seen the bear market lows for now.
Now the market must prove itself to the upside.
