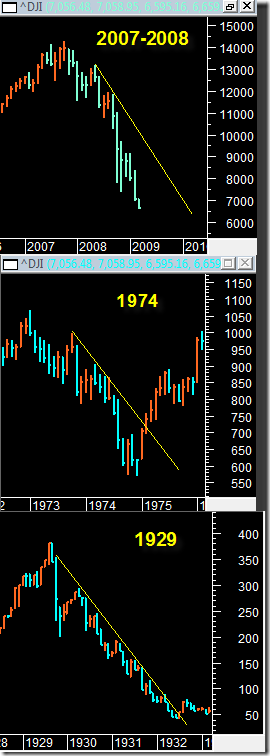
We are living through unprecedented financial history right now. It almost seems surreal because I remember having heard so many times about how bad the markets were in 1929 and 1974 but I had never lived through one of them.
But now we are right in the middle of one right now and the cold hard reality of it all is truly eye opening. Looking carefully at the price charts it really does look like we are doing a bull market in reverse. If you flip the charts upside down it will look like a persistent bull market.
But what style of bear market are we in now? Are we in a 1929 bear market that will see the Dow Jones Industrial Average ultimately decline 90% as well ? The 1929 bear market saw the Dow do about an 89% decline from ultimate peak to final low. If we were to decline 90% from our peak in 2007 it would put the Dow at roughly 1500. What is intriguing about that level is that it is close to long term 15 year support we had during the 70’s of the 1000 level.
What is my prediction? Well my own take right now is that we will have a 1974 style bear market where inflation start to kick in severely and inflates everything in sight, including the stock market. In that scenario we could see a sharp and dramatic reversal to the upside in the stock market that catches people by surprise and rallies all the way back above 10,000 on the Dow.
Given all the current negativity everywhere it seems unconscionable to think the Dow could actually get such a sharp rally going. Marc Faber pointed out a few years ago that inflationary periods in market history can lead to very large, fast and violent moves in markets. This makes sense and it is very notable. It makes sense because what you have is a market confronted with so many fast changing variables that it cannot make up its mind which way to turn. It is like a stock market that has attention deficit disorder.
So it is very likely that we will be seeing huge violent swings not only on the daily and weekly time frame charts. But also on the monthly and quarterly charts as well!
In fact that is exactly what happened in the 1974 bear market. It was the end of the world down there and then it turned on a dime and never looked back.
So again, my own take right now is that we are in the 1974 style bear.
But is there a better tool we can use to determine if we will be in a 1929 or 1974 bear going forward? Yes!
Simply focus on the three charts below (which by the way I will be updating over time and alerting you. Interested in email updates of new posts here? click here).
I think the trick in determining which type of bear market we are in can be done quite simply by drawing a down trend line along the lower highs of each bear market.
In the case of 1974 you can see that eventually the market was able to create an upside reaction that decisively broke up and through the down trend line and signaled thereafter that there would be trading range markets and more complex trading patterns in the indices.
In the case of 1929 you can see that the Dow Jones Industrial Average was never able to break above the down trend line until it finally bottomed 90% down in 1933. This is a key observation because it shows that in 1929 there was extreme trend persistence in the bear market and price was never able to exceed it’s own yellow down trend line.
So what about the current market? Well it boils down to either scenario A or B. Scenario A is that we continue down a bit more into May or June of this year and then get a rally going that brings us back up to touch the yellow down trend line. Then, we fail and break down again similar to the 1929 style.
But Scenario B is that after a bit more down move into middle of this year we get a violent upside reaction rally that is able to PIERCE the yellow downtrendline. If this happens, then it will in my opinion invalidate the 1929 scenario.
The fate of our country and perhaps the rest of the world rests on a simple yellow downtrend line! Amazing!

