The bullishness is simply astounding lately. It is remarkable. Undeniable at this point. It seems like we are up almost every Monday of the week, every Friday of the week and most days in between.
So that must mean we are overbought and ready for an extended nasty decline that will be horrible and scary right ?
Not necessarily.
Yes sentiment is at extremes, technical indicators are at extremes and it really does feel like at least a minor or intermediate pullback is way overdue. But my take going forward continues to be that the market will keep trying to frustrate the heck out of those who wish to short it.
I tried to short this market several times since October 2009 and most of those attempts failed. The only one that succeeded was the one in October 2009. I was lucky to catch that mini decline. But all the other attempts failed.
Why did they fail? They failed because the primary trend is still very strongly up and in that type of environment every pullback is generally weak and the strong upward trend is eager to reassert itself.
The issue now is what should your general 1 to 2 year trading bias be? Is it even possible to have that long a forecast? Generally speaking the farther you go out in terms of time, the more difficult it is to get a handle on potential price bias.
Unless…
Unless you have some very large patterns to work with or some other major market clues ( such as foreign indices or commodities ).
Speaking of clues, there are two potentially very powerful ones that could eventually reveal a lot of meaning to us later on. If you have been reading posts here regularly then you have probably already seen me mention them here.
The first is the precious metals. Gold appears close to staging another large northward run again based on its significant head and shoulders bottoming formation since late last year. Also silver has formed a very large head and shoulders bottoming formation that projects much higher in the next 6 to 12 months.
If the precious metals move strongly higher again to new all time highs, then I have to conclude they are leading inflation and telling us that a thick dose of inflation is ahead.
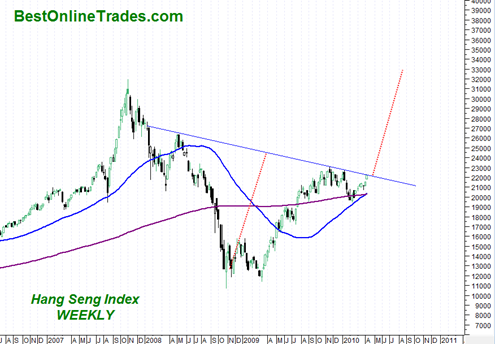
The other clue is the Hang Seng Index and the China Shanghai Composite Index. Both of these massive indices are also sporting very large head and shoulders bottoming formations. The Hang Seng Index head and shoulders bottom formation has a price projection that would shoot that index way back up to its old all time highs!
Also the 50 WEEK moving average has just crossed bullishly above the 200 WEEK moving average, another very bullish longer term sign.
So Asia indices are sending the same signal as precious metals. A massive inflationary expansion supported by governments worldwide.
I gotta tell you honestly, the precious metals signals and the Asia index signals themselves are telling me that deflation at this point is totally out of the question. The deflationary crash scenario is completely dead in my mind at this point.
I can always change my stance on that issue, but it is going to be a tall order to convince me otherwise. It will require that the precious metals fail very badly soon. And it would help if the Asia indices and the US stock indices fail badly soon as well with quick price destruction and fast loss of price support. I view both of these as unlikely at this point.
I am still open to corrections within the trend but it is my view now that the corrections when they do come will be frustrating and complex and generally not worth shorting. Similar to the corrections that occurred between the 2004 to 2007 period. Could you have made money shorting the corrections between 2004 and 2007? Of course. But was that that best longer term strategy for that period? Not really.
But the Government is Cooking the Books Right ?
The rally in the current market cannot be real! The United States government is lying, all the numbers are fake! This is not a real recovery! Unemployment is still high so the market can’t rally any more !
Forget all that nonsense. The market will do what it wants to do on its own time regardless of whether or not the ‘recovery seems real’ or not. Right now we are living in massive trading range markets where you can almost literally see in slow motion stock indices swing back and forth in very large trading ranges that seems unfathomable.
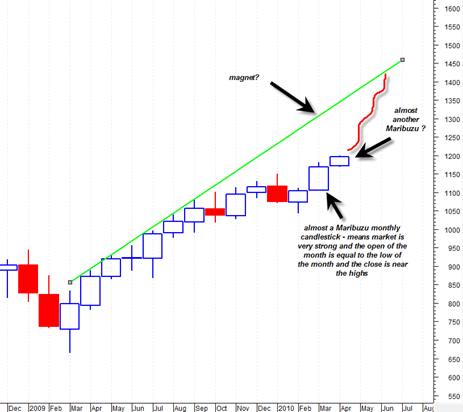
I still think that at some point the SP500 has a shot at getting up to the 1400 to 1500 range longer term. How soon that happens remains an open question, but so far the month of April is again looking strong just as March was (see chart below).
If you think it is impossible for the US market to trade all the way back up near the 2007 market highs, think again. It can happen. No, it won’t get there in a straight line, but it could eventually work its way up there. That is what inflationary pumping can do. It can cause dramatic almost unreal moves in the markets.
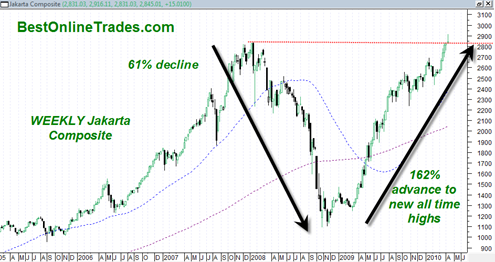
Still don’t believe me ? Well take a look at the Jakarta Composite (Indonesia). I am not saying that the Jakarta Composite index is a good proxy for the US market. But it is still interesting to contemplate how that index was able to suffer a nasty 60% correction and then completely recover all of it in a relatively short span of time.
The charts in this post are very telling. And they may be good general indications of how things will shape up by year end and then going into the all important 2012.


