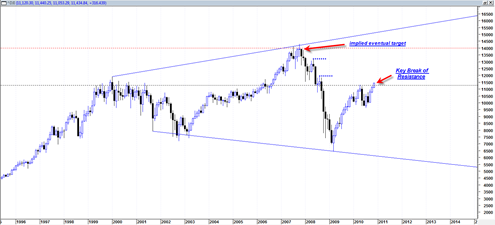
Today the Dow Jones Industrial Average accomplished a key milestone. It broke back above and into the very important resistance range that has defined a top for the DJIA several times before.
If the DJIA is able to hold a weekly, monthly and then quarterly price breakout into this range, then it implies that the DJIA should eventually make a move back up to 14,000 which is close to the 2007 all time high for this index.
The DJIA appears to be trading in a very large broadening wedge formation that has been expanding over the past decade.
Whether or not the DJIA will be able to ascend to such heights again may depend on how serious a problem inflation becomes down the road. If we continue to map out the 1975 pattern, then it would suggest that we continue to surge higher into 2011 but then reach some type of sideways plateau for an extended period of time. This is just an early speculation at this point. It could be that this time around inflation and inflationary expectations are managed, instead of getting out of control.
A move in the DJIA back up to 14,000 would correlate with a move in the sp500 back up near 1500 which is also close to the old 2007 top. These types of extreme moves seem counter intuitive. But in an environment of potentially heavy inflationary pumping, one should expect severe market extremes in both directions.
We are dealing with massive trading ranges and they key is to try to identify the major turning points and the major continuation points so as to stay on top of the primary trend. Right now I believe we have activated a significant continuation point after having consolidated since the April 2010 top.


As I pointed out previously almost all of the larger Indexes were pointing to new highs. Like I said, they were all displaying golden crosses for one thing.
Personally, I expected a correction after the election and QE2. I was wrong. But I restrained my plays and took a bath early yesterday.
Seeing the errors of my ways, I quickly changed to long, early in the AM and by today I was healthier than I was before my correction play.
I switched from short OPEN to long. OPEN has 23 million shares short interest. That should fuel an upside good for at least, minimum, a ten point move up from here.
Interestingly, I checked my broker for availability for short stock and non was available all day yesterday.
That appears the same way today, which means there is no counter balancing downside pressure. Only profit takers and why now?
Interesting.
Among other longs I took a positions in Desert Sands. LVS yesterday.
I am really expecting a very strong push on the longside probably all the way to the end of the year.
Corrections, if they come will be feeble.
I tend to agree with you. There will for sure be corrections, but my take is that bias is towards the up direction into end of year.
yes you were correct on the golden crosses, looks like they are talking loudly now..
Tom
I am not sure what you are “tending to agree with”.
Tending to agree with the idea that the market will push higher into end of year with some backing and filling along the way…