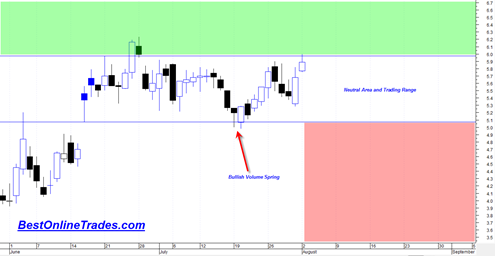
I continue to watch NBIX like a hawk because it has what I consider to be both long term, intermediate term, and short term favorable technical analysis characteristics.
I did a short write up on Neurocrine Biosciences Inc before and this is the second follow up.
The ‘moment of truth’ for any stock, bond, index, or commodity future is when it is able to ‘jump the creek’ above a longer term significant resistance zone. ‘Jump the creek’ is a term used by Richard D Wyckoff (perhaps one of the greatest traders that ever lived) to describe when a security is able to muster up enough courage to move beyond a significant previous technical resistance price level. It is when price decides to ‘engage’ to the next price range and start to wage new battles.
The resistance price level can exist in any time frame (1 minute, 5 minute, 60 minute, daily, weekly monthly, yearly charts) and also cover any time distance. Some ‘creeks’ are more famous than others. For example the mid 1970’s Dow Jones Industrial Average resistance level of 1000 was a very very significant almost 15 year long creek. The longer the creek length, the more significant it becomes as a support and resistance level. It takes tremendous amounts of energy and success to break a 5 year or 10 year resistance level. Even a 1 or 2 year creek can be tough to break through. It all depends on the stock, index or future we are dealing with.
Currently Neurocrine Biosciences Inc is perched right under a 2.5 year long resistance level or ‘creek’ at a price of 6.00. There is a large trading void above that level all the way up to 8.5 This is good because it suggests to me that if and when NBIX can get above 6, it should have plenty of leg room to move higher from there.
In addition to this significant ‘creek’ resistance level Neurocrine Biosciences Inc also has this long term down trending channel line that has defined its bear market trend. Until and if NBIX can break above this level, it still needs to be assumed that NBIX is still in a bear market even if it does break above the 2.5 year horizontal creek resistance (at 6). It is a bit difficult to come up with an exact level that defines a break of the 3.5 year down channel resistance because it will depend on how long price takes to get right under the channel line. But roughly we are talking 7.4.
So a break above 6 to me is significant, but still not as significant as a break above the 7.4 down trending channel line.
I want to see a full price bar above 6.00 and preferably a nice long candle with heavy volume. And then see more price above that range.
I don’t intend to chase NBIX right now. I would rather sit and wait for the break out above this range and then wait for the first retest of the 6.00 range for a suitable entry. There is always the risk that any stock after having ‘jumped the creek’ will fail and fall right back down under the new support (6.00). So I will take a more ‘safe’ approach here and let the stock show me the way and hopefully prove the way.

