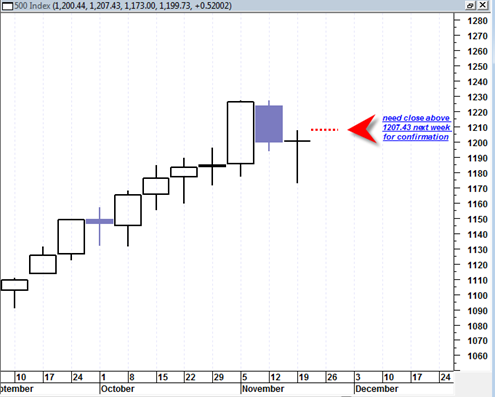
Here is a close up of the weekly reversal doji hammer on the sp500. This weekly candlestick seems to support the case that we get a reversal higher next week. To confirm this weekly candle we need a close higher than 1207.43 by the end of next week.
This reversal doji is of the long legged variety and adds to its potential signal. It should be pointed out that these reversal doji probably have a lot more meaning if they are occurring at the bottom of a downtrend as opposed to showing up after an extensive advance. Still this weekly reversal doji is showing itself in a range of previous supply (the April 2010 highs).
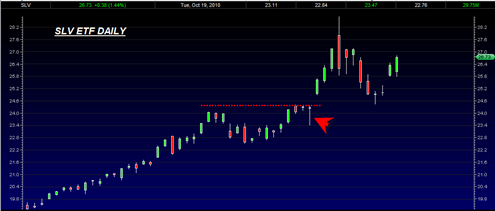
A similar but not perfect example of a doji near a previous resistance level is seen on the SLV ETF in early November 2010. The reversal doji showed up on the daily price chart:
The daily reversal doji in the SLV ETF lead to a dramatic upside breakout above the previous resistance range. Clearly the SLV is a different animal than the sp500 but the concept is the same here. A long legged reversal doji hammer forming near an important previous resistance area. It has the potential to lead to a rapid upside move that overtakes the previous resistance range. The long bottoming tail of the reversal hammer doji should be seen as being strong demand.


Tom
thank you for the comment on the wkly reversal doji.
this EW blogger that i have mentioned here more than several times, is amazingly low key (no spectacular headlines) and amazingly accurate. only been watching for about a month. but he has been really pretty “spot on” as the Brits say. http://pugsma.wordpress.com/
he is lkg for climb to 1251 (really not that much higher and than a reversal to 1135 or so, at which point it would be a major buy in point accrding to him. he thinks we are in for a long bull markt til end of decade. i do not agree with that, but at 1250, i might take another shot at shorting / getting puts. i definitely have not been successful in past month.
I don’t understand how we can get a 10 year bull market from here.. At this point the most I am looking for is about a 1 year advance with maybe most of it occurring between now and early next year.
At some point the chickens are going to come home to roost.
For now my take is that inflation will become a problem and make the stock market advance suffer and start to trade sideways and then maybe eventually roll over in my opinion.
But to say that we are going to advance for 10 years and break north of the 2007 highs is way to early in my opinion.
This other guy David Bensimon was talking about similar type forecast (sp500 at 2400 or something similar).
My hat goes off to these guys for making such a bold forecast, but we are in a very large trading range since year 2000. I don’t see us breaking out of it quite yet, my take is that it will take another 5 to 10 years before a real break through, but I could be wrong…
I think the fundamental situation / “set up” is awful, but fighting the FED and other Central Banks that do not want to face “reality” seems futile. The day of reckoning will come, but the trick is knowing when. . . . . of course. And being invested appropriately at that time. I forget what well known investor likened the current situation to crossing a ravine on a slatted very old rickity bridge. You might make it across and you might not.
I think you have some severe fundamental headwinds:
(1) China vs USA – – – a fundamental conflict, i think. China needs growth to keep its masses happy, so that implies steady demand for materials, but spells disaster for climate and possibly inflation. as a means to divert attention from problems in China, the tried and true diversion is aggression , but military aggression may be ruled out due to nuclear. . . . economic aggression may be the more practical / likely
(2) USA has for decades fundamentally lived way beyond its means and grown into the habit in the last 14 years of some how thinking that the FED or Govt will smooth out the economy and both of these institutions have seeming decided to try and repeal the normal ebb and flow of economies for a continual growth target. Now we are really living way beyond our means and trying to inflate our way out of the mess.
(3) Most of Europe is probably in similar boat as USA with exception of northern Europe
I am really struggling with how to invest. I think that sentiment is very important because extreme bullish sentiment means that people are less discerning and careful about where they are walking and may not be even looking to see if there is a “slat” over the ravine to walk on. Technical analysis i am a lot less certain about – – – the EWers of the world seem to be at extreme odds – – Prechter for example saying a cliff is ahead and this pug blogger saying next 10 yrs are bullish.
Maybe the predicament of investing has always been as it is today. . . it is just that the crash of 08 / 09 scared the heck out of me.
Tom
By the way, I have mentioned before, but I appreciate the format of your site that allows for readers to comment. Technically, it is easy to see others comments, but when comments are put to your postings that are more than a couple days old, it becomes difficult to keep the thread going. I am pretty sure that that is just the nature of the beast.
Looking at your weekly chart we can see two Doji’s on the way up that did not reverse the trend. I do not think a Doji is as reliable when you can look back on the same chart and see previous Dojis that had no effect. In this case, since the Doji did not gap down it would be more like a Harami Cross ( a more reliable bullish pattern). However, I still see this last down week as a possible confirmation process of the previous week’s Bearish Harami, but it is not a strong reversal candle.
I am not sure I am seeing the weekly bearish harami. I thought the weekly body of last week needs to be much smaller and preferably a doji candle.. Instead it is a big fat body retracement.
Geoff I am not sure how to change the way comments are done. Ideally there could just be one big comment thread that continues along side the right sidebar…..
The interesting aspect of the fundamentals is that Marty Armstrong indicated that all these world wide debt problems are actually bullish for stocks. I forget exactly how he came to that conclusion but it might be worthwhile reading his material. I suppose there is a distinction between government debt and private corporate profits. Maybe stocks will be treated like a safe haven just like gold is.
Thing is, I just do not see how both gold and the stock market can keep going up forever together. At some point the sky rocketing gold price is going to mean that every else will plummet. Problem is figuring out when things are bad enough to get to that point.
I think you might be confusing a Harami with a Harami cross
http://www.candlesticker.com/Cs41.asp
Tom: What do you think of the reversal doji in the Wilshire 5000 today, 22/22?
And by the way, I am still bullish in the short run. And my recent pic of Open has been doing magnificently!
To my bear friends: This is serious stuff, don’t be married to your emotions. You really can not make money in the stock market if you get married to an ideology. Don’t fight the tape! Even if you are right in the long run as a great economist said, “We are all dead in the long run.”
JR
you are right about being flexible and not “wedded” to a particular position. you are very right. hard to do. i am shocked that OPEN performs as it has. i think you play with fire. gl to all of us
by way this guy “pug” is really incredibly accurate and he is bull. he is starting to persuade me. . . at least a non-volatile market seems very believable thru early Jan
JR, here is what I think about it:
http://www.bestonlinetrades.com/20101122/sp500-bulls-get-their-turkey-and-eat-it-too/
Nice call on OPEN. Looks like it wants to do a triple top breakout especially with the acceleration of volume today. It might need one or more day of sideways consolidation though as the 11/3/10 swing high was on 4.4 million shares.