I think China Agritech Inc. CAGC is a good trading stock. It falls in the small cap category, is in an industry (agriculture) with very promising long term potential, has a low float, and plenty of investor and trader interest.
It is also ‘good’ in the sense that it is not trading at 300 dollars like almost everything else these days. There appears to be a value proposition based on my limited knowledge of the agriculture sector. Other big cap agriculture stocks are soaring on rising commodity prices across the board.
On their earnings date of 11/11/2010 (not confirmed) it is expected that they will clear up their accounting issue by announcing which big four accounting firm they have signed. From their Oct 8, 2010 press release:
The Company remains committed to, and is in the process of, engaging a "Big Four" auditing firm soon, which will conduct the audit of the Company’s 2010 financial results. A formal contract is expected to be signed and announced following the 2010 third quarter financial results release.
Despite this press release, there are still plenty of things that can go wrong here, for example a delayed announcement or something in the audit that comes up suspect.
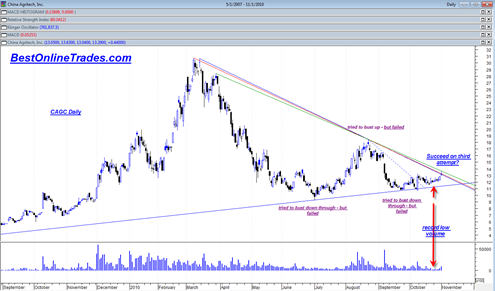
But the chart seems to be saying that CAGC could bust out north from a large pattern on or before the earnings release.
CAGC has already attempted to bust down through the bottom supporting trendline two times but has failed. It did see a good reaction north off of this line in early October 2010 but has since failed to get any strong uptrend going. I suspect the lingering doubt about earnings and big 4 accounting news is holding the stock back from any major forward leap.
On October 22, 2010 CAGC printed its lowest volume since very late November 2009. I tend to view that record low volume print as a possible indication that the final sellers have been cleaned out of the stock. In some cases in the past I have seen these record low volume prints and it has led to a whole new price advance. Of course every stock is different but I am viewing this as a clue for now.
The weekly MACD is just starting a bullish crossover stance for the first time since August 2010 which seems to support a new uptrend phase.
The daily chart above shows several down trend lines. Today the price of CAGC started to press into this resistance area. So the question now is whether it can press higher into this range.
I think the prospects are good here for a possible upside breakout and new upward trend. But it is also clear that any new uptrend is not going to be ‘cemented’ so to speak until after earnings and a possible big four accounting firm announcement.

