US Dollar Leopard versus The Wildebeest Herd Complacency Trade

Did you ever use to watch those nature shows on PBS where they showed massive herds of animals in Africa?  I used to watch those shows as a kid and it was always somewhat fascinating to see those large herds of animals feeding there but then suddenly get spooked and almost ALL at ONCE start … Read more

US Dollar to Tell the Tale of the Tape Last Week of October ?

If you think about it, Friday’s Market action (10/23/2009) was extremely revealing.  Just forget about technical indicators for a moment and pretend you could only make a judgment call about the future market direction from the tape action of this single day on Friday.  What would you conclude? Microsoft was gapping up, Amazon.com was doing … Read more

US Dollar Index Drifting Down to Some Key Support Levels

The US Dollar Index keeps drifting downward as if it is on some sort of mission.  Clearly this has helped the broad market keep going UP as well as gold.  The popular story line on the US Dollar Index right now is that sentiment wise there are too many bears and hardly any bulls.  From … Read more

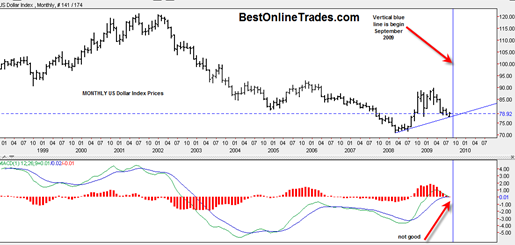
Monthly US Dollar Chart Indicating it May Break Down Severely in September

monthlyusdollarindex

I have some new information on the US Dollar index and wanted to bring it to your attention.  My obsession with the US Dollar Index continues… But why? Why am I so obsessed with the US Dollar Index.  I am because it is either going to help gold do a MEGA breakout or it could potentially hinder any breakout in gold or even cause a break down.

I just wrote a post on the negative seasonals that are kicking in for the US Dollar Index starting right now.  But I only just now discovered a new perspective on the US Dollar Index that is giving me a little extra dose of confidence that we could see the US Dollar break down severely in September and subsequently cause the gold price to spike to a new all time 30 + year high.

Read more

The Gold Market Chips are on the Table so Lets Roll

DX

The gold market chips are on the table and the US Dollar chips are on the table, now lets roll…

The gold price has now touched the top portion of the symmetrical triangle 3 times and the bottom portion 3 times.  One way or the other we will get a resolution.  Time wise I have calculated that the gold price cannot really extend much farther then end of September to make a decision because there is simply no room left inside the triangle.

The thoughts that go through my head when I look at the gold price triangle are something like, “Can this market really get an upside breakout?”, “What if the gold price extends too far into the apex?”, “This chart better start resolving itself SOON”.

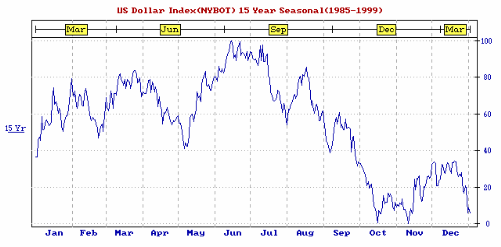
The chart above is the seasonal US Dollar chart between the years 1985 and 1999 courtesy the Moore Research Center.  What is interesting about this seasonal chart is that we can see that the US Dollar tends to have a lousy second half of the year statistically between years 1985 and 1999.  And if we look carefully at the chart we can see that the most devastating statistical downside for the US dollar starts at MID AUGUST (we are in mid August 2009 right now) and then continues almost relentlessly until mid October.

Read more

Keep an eye on The US Dollar Bounce

usdollar20090807

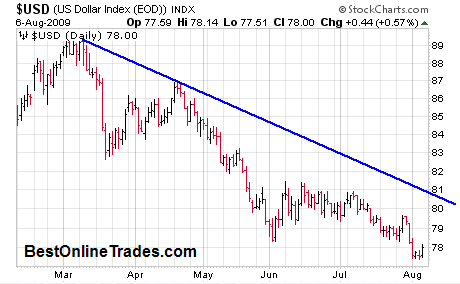
The US dollar has an upward bounce going today.  The chart above does not show today’s price move but it is near 79 right now.  It is no surprise that gold is taking a bit of a hit today. So now what?

First, before I even get into the meat of what I want to say I should tell you that there is always a bull side and a bear side to every trade, no matter what the time frame is.  There are always levels that if achieved, or if broken, can dramatically change what the outlook is. I am telling you this because there have been times when I have become extremely bullish on something, but then things started changing and key levels were broken, and I had to change my stance immediately. 

So why this talk about bull and bear side?

Read more

What would cause the Gold Price to go Truly Parabolic ?

usd20090805

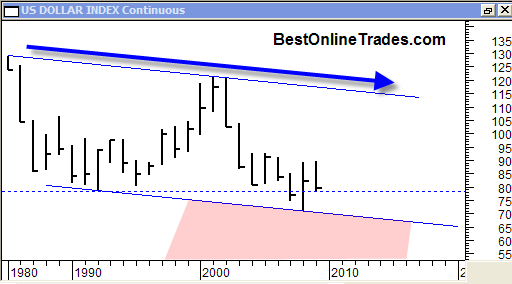
Have you ever thought what might cause the gold price to go truly parabolic (aka vertical) ?  It seems that the personality of the gold price is one of parabolic structure.  That was the case in the 70’s and so I see no reason to believe this will not be the case now.  It probably will.

The chart above is the US Dollar Index chart plotted with YEARLY price bars.  It should be quite clear that this is a very long term price chart since it takes a whole year just to complete one price bar !

Read more

US Dollar Index Bounces off of Support Creating Bullish Divergence

usdollar20090729

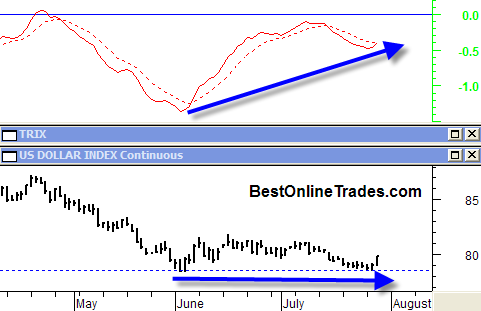
The US Dollar Index has elected to bounce off of support creating a short term double bottom.  The bounce has also created a bullish divergence which is now playing out and should allow the US Dollar to move higher shorter term.

In a previous post I was talking about how the US Dollar index was at crucial long term support and that it really needed to hold the 79 level.  A significant bearish decline could ensue with a downward break of the 79 level.  But so far the index had decided to evade this break of support and is now heading higher as a result of this moderate shorter term bullish divergence.

Read more