5 Week RSI on Sp500 Seems to Be Saying we Bounce From Here

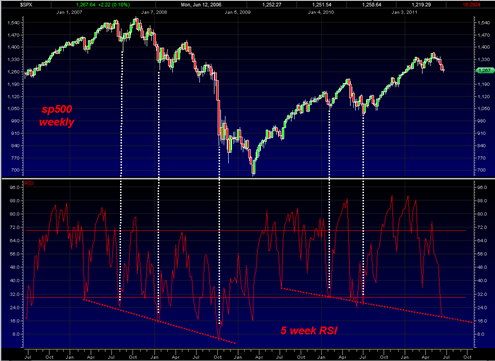
Someone emailed me a chart of the sp500 against the 5 week RSI indicating that it looked very oversold.  I decided to investigate and looked over the chart myself.  I find myself coming to the same conclusion.

I do not think I have ever focused on the 5 week RSI for timing but it seems to be making a case for a bounce from here on the weekly basis.

Of course 5 week RSI can always get more oversold into ‘extremely oversold’ range.  It is a matter of probabilities.  But the current 5 week RSI reading is showing that the market is the same oversold condition as was the case only 3 other times going back to early 2008.

If we are going to get more oversold on the 5 week RSI from here then it would start to challenge the oversold level that occurred during October of 2008 which was an extreme record and major outlier.

Read more

Tricky Analysis Currently in the sp500

I have to say that currently the analysis of the future direction of the sp500 is quite ‘tricky’.  I am thinking that I can make equal arguments for the short term bull or bear case.

There are several reasons for this.  One reason is that currently the weekly MACD on the market is on a sell signal and I have been waiting for the market to provide a northward confirmation of the weekly MACD histogram buy signal.  We did not get any confirmation this week.

Instead, on the weekly chart of the sp500 we now have a potential bearish triple M on the weekly MACD histogram which is unconfirmed.  This means that the bearish weekly potential trend could be re confirmed on a weekly close below 1333 on the sp500.

There is also the issue of the overhanging supply from the 2/28/2011 top.  It is unknown at this time how much supply still has to be worked off of this level.  We are seeing the sp500 trade in dojis and then some selling today to work off of this supply, but it is a tough call to say that we are finished working it off, we may not be.  The NYSE summation index seems to be at a resistance zone and may start to stall here.

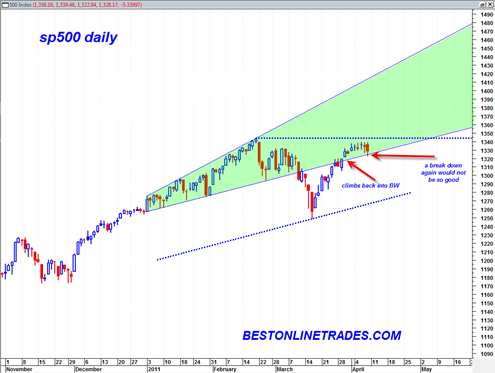
You remember that expanding broadening wedge formation in the sp500

As it turns out, we have currently climbed right back into that large broadening wedge formation…

Read more

sp500 Working on a Weekly MACD Histogram Buy Signal

The sp500 today formed a doji candlestick which simply means we are either at a pausing juncture in the short term or a reversal juncture.  This doji today formed after last Friday’s ‘false shooting star’ candlestick.  I call it a false shooting star because the topping tail was not long enough and the close was not bearish at all.

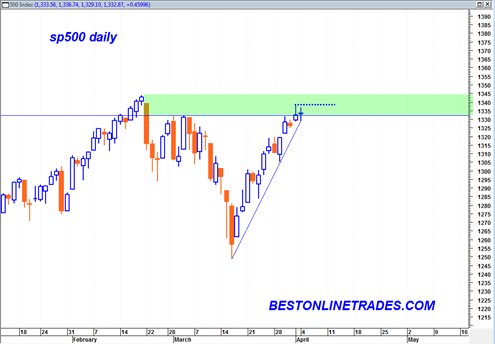
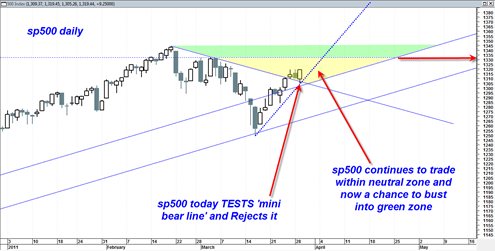
The sp500 has not closed into this green shaded zone that I have referred to several times before.  The green shaded zone is simply a close above the 1332 range which puts the market in an area of much less resistance.  We could easily close back under that zone again depending on what mood the market is in the rest of this week, but for now it appears that today is simply a pause in the uptrend and that we are on our way eventually to new 52 week highs in the sp500.

As pointed out in a previous post, the Russell 2000 is already at this stage, as well at the Dow Transports and maybe a couple other indices.  Certainly it is not a guarantee that the sp500 will do the same, but it does appear now quite likely given the behavior of other leading indices.

Read more

Russell 2000 Closes at New 52 Week High Today

The Russell 2000 is falling into its traditional role of early market leader and today closed at a new 52 week high and above the swing high that started the ‘mini earthquake bear’.

I suspect that the other major indices will soon follow suit to the upside.  The Dow Jones Industrial average almost tagged the 2/18/11 swing high today but then sold off a bit near the close.  It is possible that we could see a day or two of downside consolidation since we are at the previous highs on a number of indices.  However, after that I would expect the markets to trend higher again.

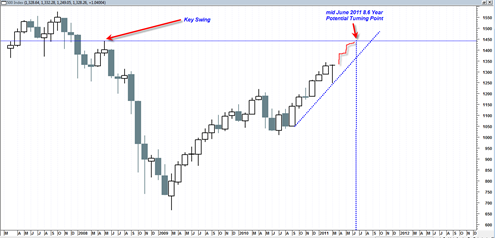
The sp500 managed to completely evade the large quarterly shooting star candlestick by trading higher in almost straight up during the last 9 trading days.  This was an astonishing feat because there was real potential for the quarterly candlestick to turn into a very bearish longer term signal.  But instead it now just looks like another typical bullish candlestick that we have become so used to seeing lately on the indices.

The monthly candle in the sp500 now looks like a very long bottoming tail doji hammer reversal candlestick which has the potential to lead to a big up month in April 2011.  The problem with this candle is that it can also be interpreted as bearish hanging man candlestick since it is at the top of a huge price advance.  So it will need confirmation of the bearish setup or a rejection.  A rejection would mean we simply trade higher up into April 2011 which appears likely.

Read more

All Systems Go on the Sp500

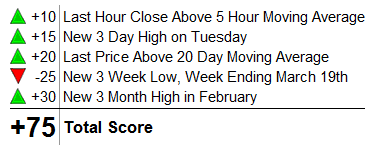
The sp500 continues to show near term trend strength and continues to trade within the ‘neutral zone’ I have referred to in previous charts.  Today was an important test of the mini bear trend line and a sound rejection of it if we look at the candlestick structure.  A closing on the highs and a small bottoming tail which reflects the test of the mini bear trend line.

The NYSE summation index is now in a more bullish stance and is close to trend strength which should support the upside over the next several days as we get into the end of the quarter (only 2 days away now).  End of quarter and end of month window dressing appears to be playing an important role this week.

I would not be surprised to see this market attempt a shot at new 52 week highs in a week or two.

The daily MACD is about to cross above the zero line, another bullish sign.  Of course volume was typically light on the advance which has always been a problem with this market.  I have learned the hard way to give price the benefit of the doubt over volume during up trends. 

Read more

Stock Market is Likely to Trade Decisively Off of Friday’s GDP Number

The way the market is trading right now suggest to me that it is going to make a decision off of the GDP number this Friday.  Odds seem to suggest that the number will either be in line or good which would seem to support a break out type move.

In recent days I have been focusing on the IWM Russell 2000 ETF as a possible leading indicator.  The Silver ETF has been perhaps the ultimate leading indicator (new 52 week highs today) with the Gold ETF being the second best leading indicator (Right at previous 52 week highs, but not new 52 week highs yet).  Then I would say the IWM falls in third place.

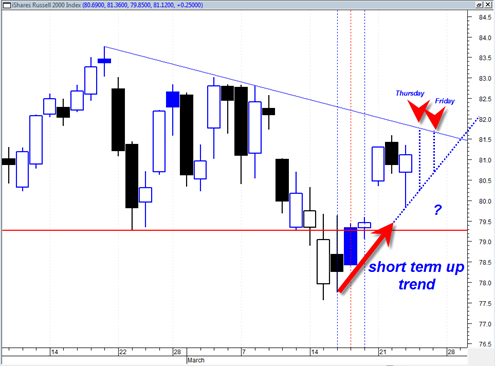
I do not want to ‘pre judge’ the IWM ETF too much at this point.  My bias now is that it is headed for an upside breakout from the current congestion range, but depending on how the end of week shapes up, it could still be at risk of a move back down into the neutral zone.

Making any commitment now would be a mistake because the market has not made any clear decision yet.  It still has to work out a few small battles in the near term.

iwm20110323

A break down through the short term up trend line is the first indication that something is wrong with the potential northward breakout.

Read more

It is all up to the IWM Russell 2000 ETF

The Russell 2000 during the recent ‘earthquake’ correction has held up surprisingly well.  During the midst of the correction I had eyed the Russell 2000 several times and it bothered me from a bearish perspective that it was not breaking down from support.  The decline was too weak.

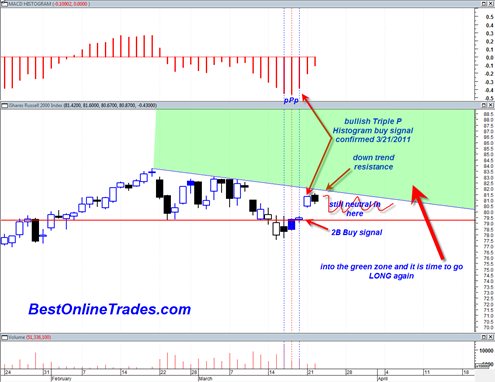
So sure enough now we see the IWM Russell 2000 small cap ETF blasting back inside the range having created a 2B Buy Signal and a confirmed daily MACD histogram buy signal. 

Like an animal trying to find its way out of a cage, the IWM is now once again near the top range of the recent pattern and it must make a decision whether to initiated a northward breakout or fall back within the neutral range and then decide later what to do.

I have seen this type of chart setup many times in the past and it looks to me like a northward breakout will come soon, perhaps by this Friday 3/25/2011.  The IWM 2 month pattern looks once again like the typical sideways type corrections that we have been seeing frequently in recent years.  These sideways corrections, that show an inability to get real % damage to the downside are the most bullish type of corrections.

Read more

Pressure is on the Bulls Next 9 Trading Days

In my opinion all the pressure is on the “Bernanke Bulls” for the next 9 trading days as we go into the end of the first quarter.  They are going to have to pull off their usual and typical ‘miracle runs’ where they manage to evade resistance levels, evade bearish candlesticks, and evade technical oscillators that are going against them now.  Of course it is quite possible for this group to pull it off once again, but I do not believe they will be successful this time around.  Already I am hearing elliott wave arguments about how we have to go to 1400+ first.  I just don’t see it.

At this point I would say that 1294 is the battle line in the sand that defines who is going to win the next big move in the tape action on the sp500.  1294 represents a key support level that was broken on high volume to the downside.  Now this 1294 level has transformed into resistance and should act like a brick wall for the bulls next week (assuming the bears have the right stuff this time around).

The daily candlestick today on the sp500 was a shooting star hammer reversal candlestick, but still unconfirmed.  These reversal candlesticks on the sp500 have not proven to be very reliable.  So the market could still easily trade higher early next week and evade the short term bearish implications of today’s candlestick.

Read more

sp500 Broadening Wedge Still Forming

The Broadening wedge formation in the sp500 is still filling out its formation and in general I am viewing this as an eventual bearish resolution type pattern with the outside potential of it turning into a very bearish cascade type decline resolution.

Rising Broadening wedges are a very frustrating type formation because there exists an up trend and yet it is an uptrend defined by an expanding trading range which can be very difficult to identify in the early formation phase.

The weekly MACD and the weekly histogram on the sp500, the nasdaq and the DJIA all see to be confirming the idea that we are topping now and should get a bearish resolution out of this pattern.  I have to say that I will be utterly shocked to see a very strong (and quick) bullish resolution out of this pattern the next few weeks.  I have been shocked before, but I truly will be this time around if we see a bull resolution out of it.

There are a number of reasons why I think we will get extended bearish resolution soon:

  • The weekly MACD is almost at a negative crossover and curl over point.  Sometimes the actual crossover can lead to a bullish move, but the potential bearishness of the crossover is undeniable.  My chart work is showing that this bearish crossover should occur either by the end of this week or next week.  That should mean hard down prices soon.
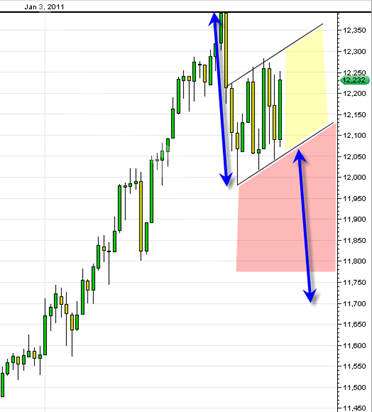
  • The DJIA appears to be trading in a violent trading range both up and down lately that defines a rising flag formation that has a clear measured down move.
  • I am seeing head and shoulder topping formations on most of the indices.
  • I am seeing 3 weekly hanging man candlesticks on the Nasdaq Composite which are still unconfirmed, however to see three of them in a row is a worrying sign.
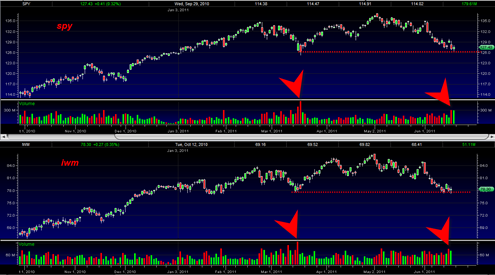
  • The negative heavy volume versus light up volume relationships on the SPY ETF in the recent 3 weeks looks much more bearish than the consolidation that occurred in November 2010.  This time around I am seeing much more consistent heavy volume down moves that are more regular and heavy.  The up days volume is horrible.  This volume pattern suggests to me strongly that we are undergoing distribution currently (big money is moving out of the market).  Of course 200 point DJIA up days like we see today are a completely DISTRACTING smoke and mirrors situation that blinds those who don’t also look at the volume relationships.
  • If we eliminate all the points I just made above, then just the simple anecdotal point I mentioned in a previous post could be enough reason for us being at a top.  The anecdotal point I am referring to is the sub headline on CNBC a week ago that already quickly presumed in question form "on the next leg up will financials lead the way?”.
  • NYSE summation index is back in bearish trend mode.
  • High flyers such as NFLX on the monthly chart created a huge topping tail on the monthly candle and point to bullish exhaustion for some techs
  • AAPL also looks ready to start a bearish trend again.
  • The VIX volatility index has a bullish weekly trend and broke out of the long term down trend line.
  • The US Dollar so far has not busted below its long term 3 year up trend line and so far on the monthly candlestick is showing a March reversal hammer that could lead to bullish resolution for April.  If the inverse correlation with the sp500 is still valid then it supports the case of a big down move in stock market and big up move in the dollar index off of support.  Perhaps this would be related to the ending of QE and a tick up in rates to support the dollar?

Read more