The Gold Price Initiates Breakout from 30 Year Cup and Handle Pattern !

GLD20090902

I am only going to do one post today and it is going to be on the GLD ETF because I want to emphasize how important a day it was today in the gold market.

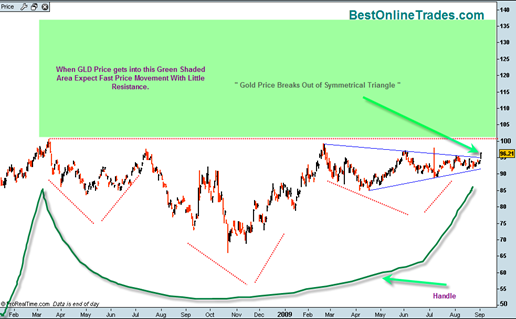
Today we broke out north from the large symmetrical triangle with confirmed volume and confirmed sign of strength.  The triangle formation has been developing since February-March 2009 time frame.  This is quite a large triangle and has significant cause for an extended move.

But there is even better news.  This symmetrical triangle also makes up the right shoulder of the much larger head and shoulders bottom formation that has been in existence since March of 2008.

And there is even more better news.  The entire head and shoulders bottom formation of approximately 1.5 years in duration is in itself the handle of a super large cup and handle formation which is 30 years long.

Read more

I Can See the Future and it Looks Like the 1974 S&P500

1974monthlysp500

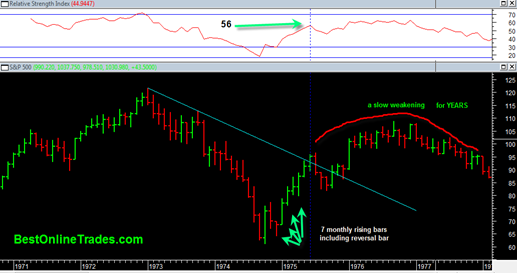
I don’t have a crystal ball that tells me what is in store for the future.  But the closest thing to a crystal ball that I have found so far is the 1974 time period of the S&P500.  The entire structure of the market during the time frame of 1968 to 1982 has given me a lot of good perspective and understanding about our current market and has helped to give me great clues and better confidence about where our current S&P500 may be headed in the future.

Now you may be asking yourself, what on earth does 1974 have to do with today ? Nothing actually.  But what I have found over the years is that sometimes past market movements tend to rhyme and show similar structure and trend development.

Read more

LEAP Leap Wireless International May Be Set up for a 10% Upside Move

leap20090826

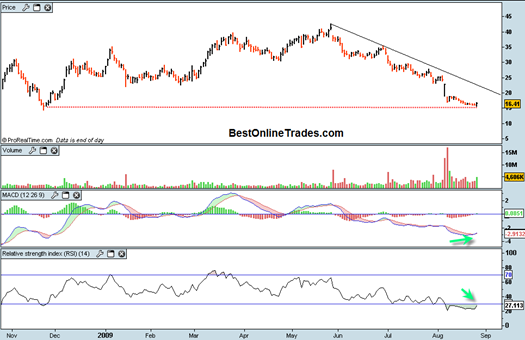
LEAP looks like a good setup to possible deliver about 10% returns starting from tomorrow in the AM.  I found leap by doing a stock scan of over 4700 nasdaq and NYSE stocks filtering for MACD daily buy signal and RSI less than 50.

Only 6 stocks came up from the scan because I had put the limitation that they should also be trading greater than 1 million shares.

LEAP looks good to me for several reasons.  It is doing a retest of an important late November 2008 swing low.  The daily MACD has extended to the downside and has given a bullish cross.  Relative Strength Index is very oversold and looks like it will soon give a buy signal.

Read more

CBL CBL & Associates Properties May Get a Cup and Handle Breakout Soon

CBL looks like it has a cup and handle setup and if CBL can get a price move above 8.80 I think we could see breakout type action and a continuation uptrend. CBL probably should have been the first stock I mentioned today.  All the others I have talked about so far today are not … Read more

GRRF China GrenTech Corporation May Fill the Gap then Find Trendline Support

grrf20090825

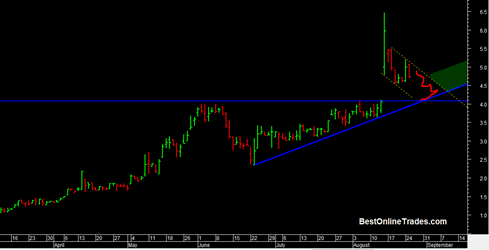
GRRF had a huge upward breakout spike in early August on some good earnings numbers.  Since that price spike the price of GRRF has been trending down within a steep down trend channel denoted by the yellow dotted lines (click on chart to see full size).

Right now I am thinking that GRRF is going to retrace this huge move and attempt to fill the large opening breakout gap and maybe come down into the low 4 range.

If it can fill this gap and hold support at the 4.10 range then I think GRRF may have a shot at resuming the uptrend and get a test going of the high volume swing high that created the gap.

GRRF should be able to fill this channel and make a decision no later than September 8th, 2009.  But I am going to have to watch price and see how it behaves when and if it is able to get into the low 4 range.

Read more

DRYS DryShips May be Headed for a Triple Bottom

drys20090825

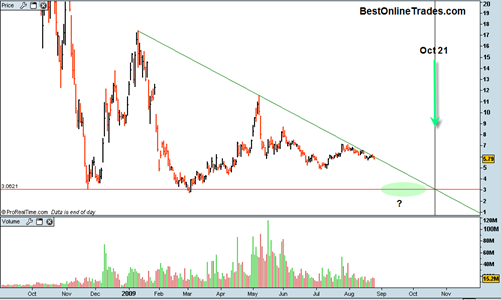
DRYS DryShips over the past year has had some really huge swings and enormous daily volumes.  It rallied from a price of 3 to 16 in the past and then made a double bottom and rallied from 3 to 11.  Clearly  DRYS is capable of making some big moves on the upside and downside.

The current structure of the chart suggests to me that DRYS is still not done with its bear market yet despite the huge intermittent rallies.  It has a strong down trending force defined by the green down trendline and so far has obeyed that downward force.  Price has not been able to break above this line. 

So we still have a generally bearish trend in DRYS.

Read more

Spot Gold Price Daily Chart Shows a Double Inside Day

gld20090825

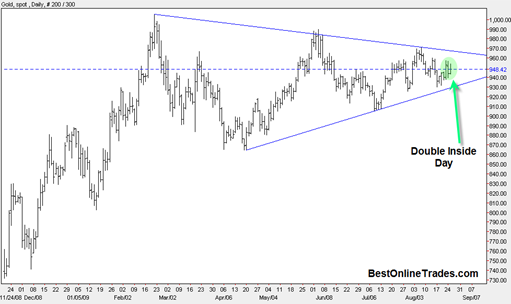
If you ever want to know what it feels like to be bi-polar, all you have to do is start watching the gold price on a daily basis.  Two days ago gold was up big leading one to believe that a breakout may start.  Then the next day the gold price took a major body blow to the downside.  Then today (at least so far) spot gold popped right back up again.

But this ‘bi polar’ type price action is accomplishing something important.  It is filling in the large symmetrical triangle that has formed in the gold price since the mid February 2009 time frame.  This is a large triangle and has a lot of significance in terms of the amount of of energy that is being built up.

Read more

Almost Never Hold a Stock or ETF after a Shooting Star Candle or Price Bar

cegeshootingstar

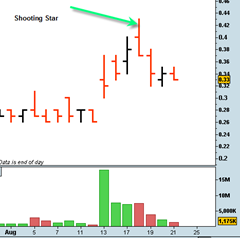
After a stock has had a significant advance it usually never pays in my experience to hold on after you see a price bar reversal that resembles a shooting star candle stick.

There are specific definitions of exactly how a shooting star candle stick should look.  But in my experience, any price bar that shows a large intra day advance above the days previous high and then closes back under that high and near the bottom of the range is a very bearish short term signal for me.

It seems like almost every time I have seen one of these price bars the next day or few days price action has been very weak and down.

Sometimes these reversal bars can lead to really significant price destruction for a long time.  It all depends in what phase of the trading cycle a stock is in.  But regardless of the phase it is in, most of the time it is prudent to bail out and seek safer waters.

Read more

ERPLQ Energy Partners Limited may Breakout Soon

The market is taking a slight beating today but EPLRQ, a somewhat spotty and thin trade penny stock has a pretty decent pattern and may get a run going if it manages to consistently trade above .45. It pattern looks somewhat like a head and shoulders bottom formation with the right shoulder being much longer … Read more

Gold Futures create a Double Inside Quarter

goldfutures20090729

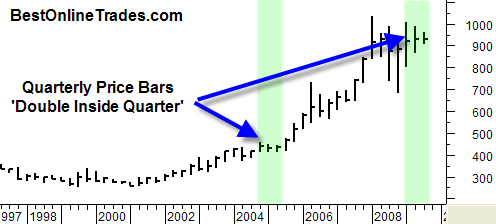
The chart you are looking at here is the quarterly price bar chart for the continuous gold contract.  I love long term charts like quarterlies because they forecast bull market moves and are definitely geared towards longer term forecasts.  This gold futures chart is no exception.

Something very significant has developed in the gold price on the quarterly chart.  For the first time since 2004 (that was a long time ago!) we see a double inside quarter developing.  A double inside quarter exists when the two most recent price bars each have lower highs and higher lows than the preceding price bar.  It is similar to a ‘coiled spring’ in that you have price compression.  These ‘double inside’ patterns do not really forecast price direction either up or down, so we could see a big move up and out of this pattern, or down and out of the pattern.

Read more