Weekly MACD on the SP500 Still Showing No Signs of Real Bearish Trend Yet

I continue to believe that it is a mistake to even THINK of going short until we start to see some early signs of a bearish weekly MACD downward cross.  At least up until last Friday, the weekly MACD has not moved into such a stance yet. It is going to take price closings on … Read more

US Dollar Index Drifting Down to Some Key Support Levels

The US Dollar Index keeps drifting downward as if it is on some sort of mission.  Clearly this has helped the broad market keep going UP as well as gold.  The popular story line on the US Dollar Index right now is that sentiment wise there are too many bears and hardly any bulls.  From … Read more

I am Going to Run With the Bulls Again TA Travel Centers of America

Well for a little while anyway.  I am glad I finally recovered from my own personal ‘October scare’ watching the market last week and feel that I have at least half my sanity back now.  So I am gonna run with a bulls a bit more and see what I can find.

The bottom line is, if you show me a good chart whether it be a stock or an ETF, then it is worthwhile exploring if there is some potential regardless of what the rest of the market is doing.  It may mean that you have to use tighter stops to control risk, but might as well go with the predominant trend force.

A Stock is Never too High to Buy and Never Too Low to Sell

That is the quote from Jesse Livermore that I paraphrased a bit.  I don’t know the exact quote, but I am writing it again because I think it is a very important point.  But again, manage risk prudently and use tighter stops and closely defined entries.

Buying stocks ‘high’ is also referred to as ‘momentum trading’.  I believe statistically it may produce more winning trades than any other method for the simple reason that you are making trades along side the predominant force in the market and in many cases that force is likely to continue.

In the past I used to be afraid to trade momentum because I could not remove the blockage in my mind how scary it is to ‘buy high’.  Not anymore.

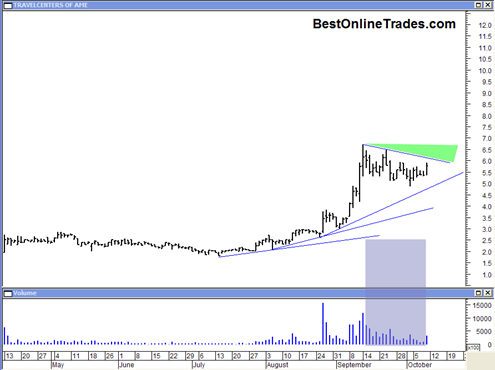
So that brings me to TA Travel Centers of America.ta20091009

Read more

SP500 Breaks First Critical Wedge Support Today on Heavy Volume

The SPY slammed down through first trendline support today on substantial volume and once again confirmed the bear case that I have been talking about this week.  It was really bearish action today and the dip buying that used to work so well in recent months clearly failed this time. Right now I am thinking … Read more

S&P500 weekly MACD is Going to Nail the Top

sp50020090928

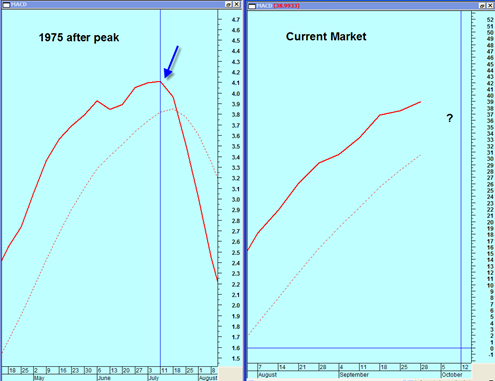
The chart above shows the weekly MACD plotted against the S&P500 for the 1975 period (left half) and the 2009 period (right half).  The downside weekly MACD crossover that occurred in the 1975 period was the first major turn in that market after a super sized rally that was in progress from the major 1974 bear market lows.

The weekly MACD is nice to use for turning points sometimes because it evens out all the extra noise and helps to identify more meaningful turning points.  Sometimes it fails during extremely persistent trends.

I have written a few times before here at BestOnlineTrades about the similarities between the current mega rally from the March lows and the mega rally that occurred from the 1974 bear market lows.  The likeness is quite surprising and if the similarity continues then I expect we will get a bearish downside crossover on the weekly MACD similar to what occurred during the 1975 period that led to an eventual approximate 15% downside correction and then went into a 5 to 6 month basing period.

The current weekly MACD has not turned down yet and it has not achieved a crossover yet.  But I think we are close.  I calculate that the cross should occur within the next 1 to 3 weeks, most likely by mid October.  For the weekly MACD to start turning down so that the MACD signal line gets close to crossing the moving average line (dotted line), we need to see in the week ahead and the week after price CLOSES that are not much higher than the recent all time highs.  Preferably we want to see price closes that are in the current S&P500 trading range for a week or two.  That would help this weekly MACD towards a bearish cross.

The mid October time frame is consistent with Terry Laundry’s latest T Theory Update. (He has an audio update and PDF chart that goes with it).

Read more

I still like ABK Ambac Financial for a Potential Buy Setup

abk20090908

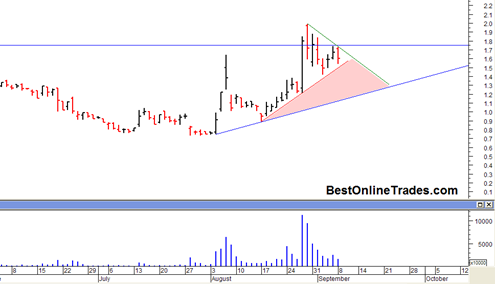
Despite how lousy the broad market has been lately and will probably continue to be, I am still watching ABK Ambac Financial for a possible buy setup.  I would like to see ABK get over 1.75 and also see volume come in heavy again.

I am thinking that ABK probably will not be able to do that until a couple more weeks consolidation.  I could be wrong, but that is the theory I am running with right now.

ABK’s business is supposed to be dead right now along with the other bond insurers because they are not writing new business.  But then why are the stock prices trending up so bullishly? The stock prices are powering higher apparently because of an uptick in home sales which could mean lower losses on mortgage backed securities.

But as you probably know by now I am not a ‘fundamental kind of guy’.  I am more a technical analysis kind of guy (that sounds bad doesn’t it ?).

Read more