AXL American Axle & Manufacturing Holdings Poised for Breakout

AXL has a very nice large pattern in the form of an inverse head and shoulders bottom.  This is a high reliability pattern and it is occurring over a time frame of 1.5 years which makes its breakout implications very significant. The right shoulder portion of the pattern has a saucer or scalloping type formation … Read more

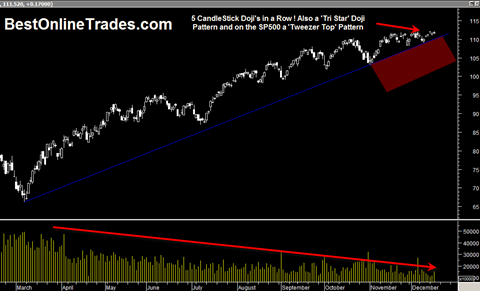
SPY ETF Shows some Possible Ominous Bearish CandleStick Patterns

SPY200910172009

There are only about 8 real trading days left until the end of the year if you exclude the days around Christmas.  So that means about 8 trading days to create the final YEARLY price bar close and then start the next one for 2010.

The market has powered up so fast and so persistently in 2009 that one would think people would take at least a few points of profit and capital gains.  For us to close the 2009 yearly price bar only a couple points from the yearly high seems improbable.  Just like on a daily price bar right before 4PM you see day traders exiting, I think we could see similar type price behavior going into end of this year.

In addition I should also tell you that I have noticed some OMINOUSLY bearish looking candlestick formations in recent days on the SPY ETF and DIA ETF and also the SP500.

Read more

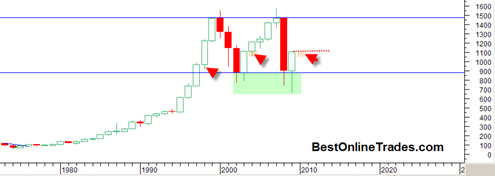
SP500 Yearly Candlestick Chart Shows Bullish Bottoming Tail and Range

sp500yearly

This is a very interesting candlestick chart of the SP500.  It is the YEARLY price candlestick long term chart.  There are few interesting things we can see from this chart.  The most obvious is the very clear long term trading range almost 10 years long.  Despite all the bears endless preaching the fact is that so far at least the market has not been able to break DOWN out of this trading range and therefore keeps the cause building consolidation case intact.  The longer the market trades within this large trading range without breaking down under 900, the better argument can be made that eventually it will break topside.

The other thing to note is the current 2009 yearly candlestick.  This massive yearly candlestick has a large bottoming tail which indicates the strong demand that came in and held prices within the trading range.

Read more

SP500 Setting up for Another Bearish Weekly Close going into End of Week

Today was yet another interesting day in the market.  I went short the XLF near the close with a bunch of put options and also went long the TZA again.  The bears in my opinion won the day.  We continue to see a market that keeps doling out positive news and yet the market continues … Read more

US Dollar to Tell the Tale of the Tape Last Week of October ?

If you think about it, Friday’s Market action (10/23/2009) was extremely revealing.  Just forget about technical indicators for a moment and pretend you could only make a judgment call about the future market direction from the tape action of this single day on Friday.  What would you conclude? Microsoft was gapping up, Amazon.com was doing … Read more