SPDR S&P 500 ETF Drifts Lower Today on Meager Volume

The SPDR S&P 500 ETF today broke down today on 35% greater volume than yesterday although still relatively lower volume as compared to other break downs in recent months.

Today the SPY candle engulfed yesterday’s doji candlestick on 35% greater volume.  On the Dow Diamonds DIA SPDR Dow Jones Industrial Average ETF today we engulfed yesterday’s near perfect doji on 55% greater volume.

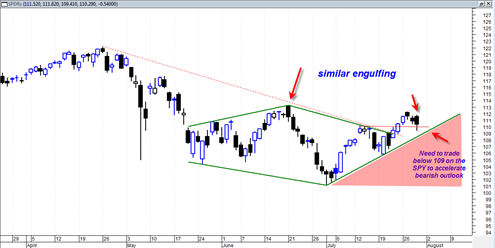
This bearish engulfing setup is somewhat similar to the one that occurred on 6/21/2010 except that today’s engulfing has a slightly more bearish volume characteristic.

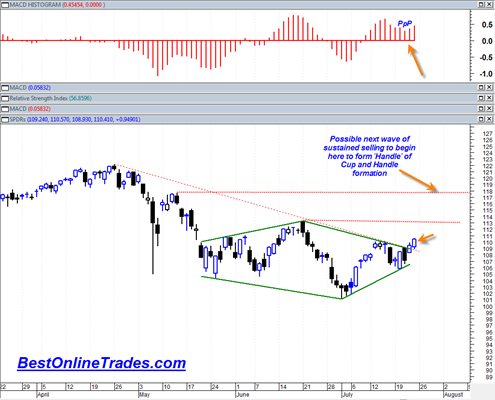
Despite these short term signals the fact still remains right now that the SPDR S&P 500 ETF is still trading both above the red dotted down trend line that has defined the bear phase and also above the near term green up trendline since July 1, 2010.

spy20100729

These two facts make it hard to be super bearish right now despite the near term signals of a possible turn down in the market right here.  It looks like the GDP report tomorrow is going to swing this market in a decisive direction.

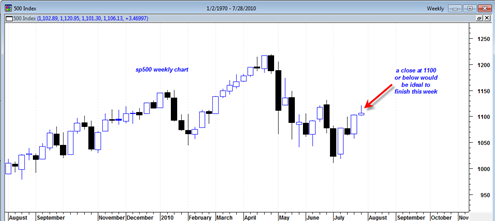
I mentioned in yesterday’s post that the 1100 level on the sp500 was minor support and ideally for the bearish case would close near there or below it by end of this week.  That type of close would set up a nice weekly hammer reversal candlestick and give a good shot at next week being hard down.  Breaking below the 1100 level enough on the sp500 could help to accelerate selling a bit and also create a 2B sell signal.  But again, unless we start trading seriously below the 109 level on the SPDR S&P 500 ETF then I have to conclude that the bulls still have some steam left.

Read more

Semiconductor HOLDRs SMH ETF Breaks Down From Trading Range

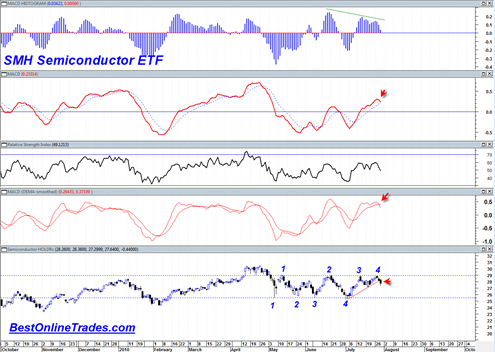
The Semiconductor HOLDRs ETF or the SMH today broke down with heavy volume through the short term uptrend that has been defined since July 1st, 2010.  It looks like a valid break of this short term up trendline and it was done so with volume conviction.  Some may say that the Semiconductor HOLDRs are a … Read more

Weekly sp500 Close this Friday Very Important for Bearish View

Today was only slightly down on light volume.  We did however confirm yesterday’s doji candlestick (by closing under it) as a reversal candlestick and someone emailed me that there was also a ‘bearish meeting lines’ candlestick formation on the two previous days candlesticks.  So both of these appear to be confirmed today. However despite today’s … Read more

One more Shot at the Short Side of the Sp500 and SPDR S&P 500 ETF

Despite my recent bullish tendencies I am becoming a bit concerned today about the uptrend.  I think it has exhausted itself today and may start to turn down tomorrow, perhaps very hard.  I am looking to go short the market tomorrow in the early AM via the various short ETFS and may be looking to … Read more

SPDR S&P 500 ETF Confirms Bullish MACD Histogram Buy Signal

The SPDR S&P 500 ETF confirmed a bullish MACD histogram buy signal yesterday (7/23/2010) by closing above 109.94 yesterday.  Not only that but the SPDR S&P 500 ETF has broken through the bear market resistance line that started end of April 2010. This breakout was also a breakout north out of the large diamond trading … Read more

Small Inverse Head and Shoulders on Sp500

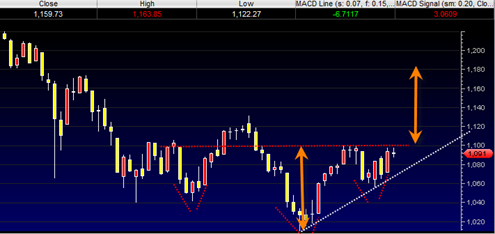
Here is the inverse head and shoulders pattern I was talking about yesterday on the SP500.  The neckline of this pattern is roughly 1100 and so it is pretty clear at this point that the battle line of near term consequence is 1100.  A big breakout above this line and it would go one strong … Read more

The Stock Market Bulls Won Today

If you have been following my posts you probably know exactly what I am going to say in this post.  The bulls won today very clearly and it was a decisive day in terms of volume (276 million shares on the SPY) and price strength at resistance.  This was not necessarily blockbuster volume but it was surprisingly robust especially considering the volume pattern since late April 2010.  I believe it is time for the bears to raise the white flag and move on.  The market is also starting to break out above the diamond chart pattern I talked about yesterday and should now be implying that this diamond pattern was a reversal pattern, not a continuation pattern.

The bearish MACD histogram setup was not confirmed today clearly.  Instead we now have a bullish triple P pattern in the MACD histogram and it will be confirmed if we close above 1097.50 either tomorrow or next week.  Instead of the MACD failing at the zero line it now looks like it wants to blast above the zero line which is quite bullish.  In addition relative strength index is itching to blast higher than the 50 range midpoint, another bullish sign.  The summation index which I was concerned about yesterday because it ticked upwards did so again today and clearly shows new momentum is now topside.

Staying with the bearish case because of ‘bad news’ is usually never a good idea.  The problem with news is that the mainstream financial media chooses which news items they believe are the most important.  But in many cases or perhaps most cases the news items they choose as headliners on a daily and weekly basis are usually just a representation of the crowd mentality and usually the crowd is wrong.  So everyone gets sucked into these major headliner news items (ie. Europe debt problems, oil spill) but these news items are not necessarily what the stock market really cares about.  The market cares about supply and demand and ultimately the battles will be won or lost based solely on those factors.

sp50020100722

The current setup in the market reminds me a little bit of 2003 when the market was all nervous about us going into Iraq to start war.  There was confusion about whether the dropping of the bombs would tank the stock market or rally the market.  As it turned out it caused the market to rally big time.  The series of bottoms leading up to that 2003 turning point was a series of retests each time on lighter volume.  This is also what I have seen since the first May 6, 2010 low.  A series of lows each on lighter volume.  And now we are seeing an upside expansion of volume.  If it walks like a bottom, talks like a bottom and acts like a bottom it probably is.

Read more

sp500 about to Breakout or Break Down from Diamond Formation

Trader’s worldwide need to pay attention to this important pattern developing in the major indices.

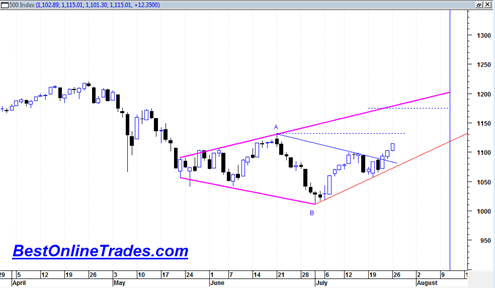
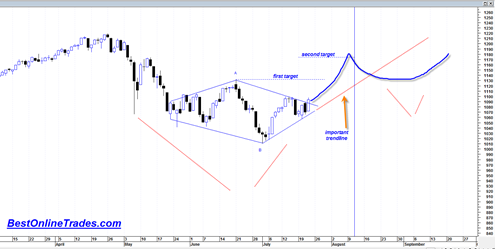
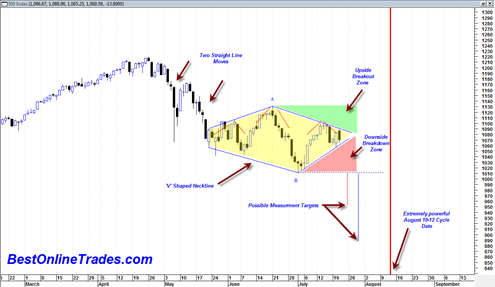
Both the sp500 and the SPDR S&P 500 ETF as well as a few other indices have as of today completed the formation of a quite large diamond chart pattern.  This is without a doubt one of the most disgusting technical analysis patterns in existence because of its ability to confuse both bears and bulls and basically keep them in a washing machine whipsawing them all over the place.

It is also extremely difficult to spot early on.  I wish I had known ahead of time that this pattern was about to form as it would have made things a bit easier.

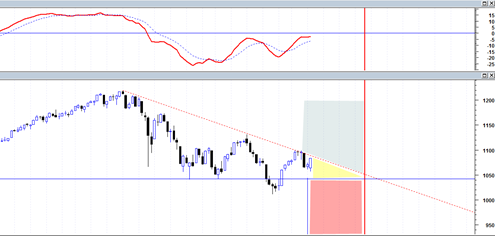
So the situation right now is that the sp500 is near the apex of this pattern and soon a result will come out of the pattern either bearish or bullish.  This diamond pattern can either be a continuation pattern or a reversal pattern.  If it is a continuation pattern then we would expect a similar somewhat straight line move down out of the pattern similar to the straight line move that lead to the construction of the pattern (the end of April to May 6th price move).  This would activate if we get into the red shaded area on the chart below.

If it is a reversal pattern then we should see a topside breakout out of the pattern into the green shaded area.

Read more

Keep the Bullish Scenario in your Back Pocket

The market action today was not the stuff of bear market action.  It was a massive bullish engulfing of a previous day indecision doji.  The daily MACD histogram sell signal which I mentioned yesterday would likely be confirmed today was not confirmed today.  In addition the WEEKLY macd histogram at least as of the second … Read more