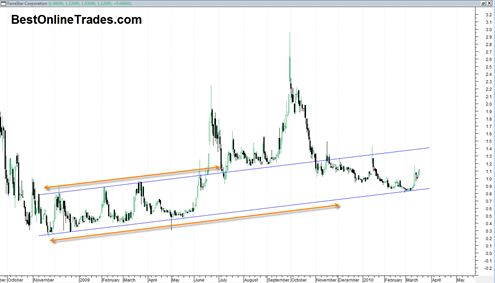
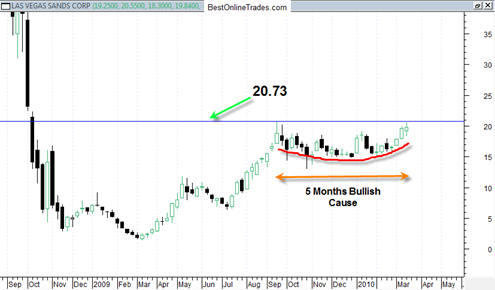
Hanmi Financial Corp may do a continuation breakout soon

HAFC has recently broken out north out of a quite large ascending triangle formation and has done so with a wide price spread and heavy volume, confirming it.  The volume was slightly less than the highest volume swing in the previous range and so that is somewhat of a concern.  However at least for now … Read more

China Agritech Inc Pulls back to the bottom of the broadening wedge formation

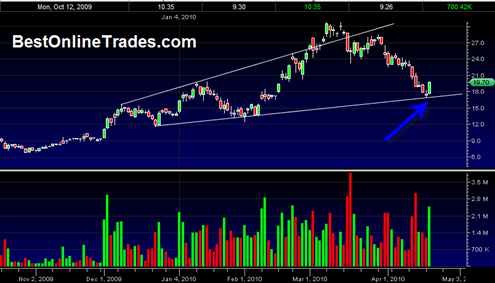
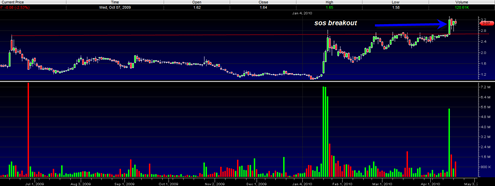
China Agritech Inc CAGC has pulled back all the way to the bottom of its broadening wedge formation and it did it a lot sooner than I thought it would.  I indicated in a previous post that China Agritech has a habit of being just as volatile on the downside as to the upside.

CAGC was way overdue for some type of pullback given its recent 130% super move in just a month and a half to the upside.  Then some insiders started selling and I believe gross margins started to slip a little bit and so people started dumping shares.  It is probably a true statement to say that when any company gets near a 500 million dollar market cap it enters a new juncture where it must prove itself and show that it is ready to enter mid cap land and be able to continue to sustain growth despite the competition.

I don’t know whether this will be the case.  But I do know that CAGC has touched the falling wedge support and so far today has shown a nice price reaction off of this support.  The recent two candlestick bars also appeared to be a morning star candlestick pattern which is a reversal pattern.

Read more

Fannie Mae Level 2 and Chart Structure looks Good

Everything is flying up lately including the ever so hated Fannie Mae and Freddie mac.  These two stocks are laggards however they do seem to be catching a good spark and overall the chart structures of both seem supportive of a big breakout within the next two weeks or so.

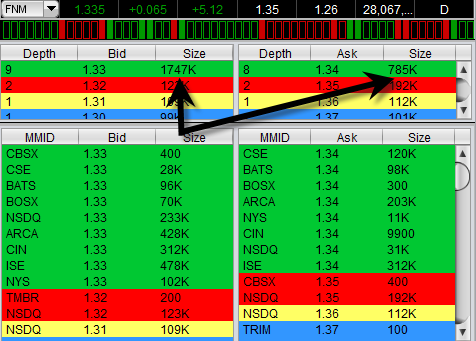
I have been watching level 2 on both of these stocks and I have consistently seen very strong bid support relative to ask volume.  In fact on some occasions the bid support has been stronger than ask volume by a factor of 10 to 1.  So it is telling me that there is some heavy accumulation going on the last several days and ‘they’ appear to want to take both of these higher. 

This should not come as surprise however because most other financials stocks are zooming higher as well such as AIG and BAC and C as well.  Both FNM and FRE are late to the party so to speak but it could be that they are doing a pre earnings run up which I have not been able to confirm as May 6th, 2010.  Yahoo Finance says May 10th, 2010.

fnmlevel2

Level 2 has been useful to me to see the demand and supply situation of a stock.  Usually it is just useful for entries and exits but sometimes you can see a pattern emerge over time as seems to be the case with both FNM and FRE.

Read more

Houston American Energy Corporation May Do a Reversal This Week

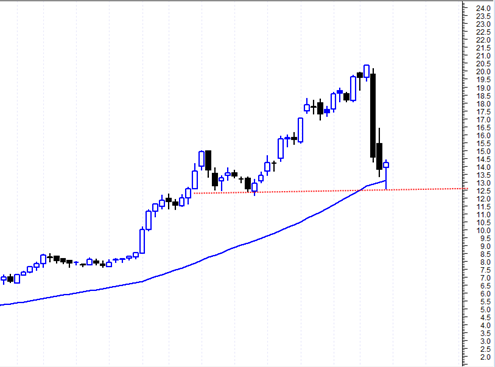
 HUSA Houston American Energy Corporation may get some type of upside reversal going this week based on the reversal hammer I see and the test of recent support area.

This stock came up in a scan from my scanning software.  I was trying to make a formula that finds reversal hammers with long lower candlestick shadows and a hammer body size that is significantly smaller than the entire days range.  Needless to say it was quite a pain at first to work this formula into the software but I think I got it working now and it seems to be churning out some interesting setups such as this one.

I think reversal hammers are a lot more reliable after there has been enough significant choppy price decline before the hammer occurs.  In the case of HUSA, I see that we so far only had 2 big down days that were very fast, so it may make this hammer reversal less reliable and there could actually still be downside continuation this week.

However if HUSA can manage to stay above 13.5 on Monday (4/12/2010), then it could be that some type of reversal could get going into Tuesday to Friday of this week.

Read more

Freddie Mac May Move in Sympathy with AIG soon

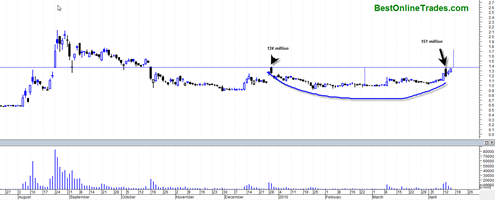
Freddie Mac (FRE) currently price at 1.34 may move higher in sympathy with AIG American International Group, Inc. soon.  FRE continues to be dogged by the housing depression and the government involvement or lack thereof.

However the economy is on the mend and there are some bright spots appear that may lift the shares of Freddie Mac  FRE soon. 

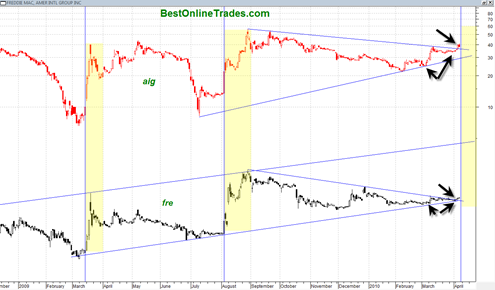
If you put the share prices of AIG and FRE right on top of each other you will see a general tendency towards symmetry on some of the big moves each stock has made over the last year.  There appears to be a slight lag effect in the movement of FRE relative to AIG.

Significantly, AIG has just recently broken out north from a very long term downward sloping resistance line and what also appears to be a very large triangle formation.  Similarly Freddie Mac  FRE has also just done the same thing although it has not really had a breakout type move out of this triangle yet.  To accomplish that it will need to trade and move over the 1.38 level which it may do early next week.

Read more

Las Vegas Sands Corp. (LVS) is behaving like a Champ

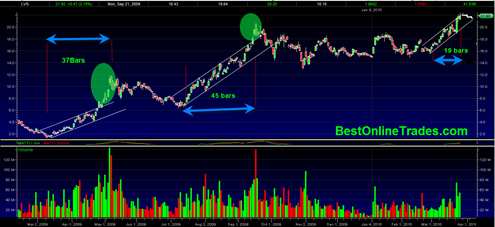
Marina_Bay_Sands_model_1 Las Vegas Sands Corp. (LVS) which I first mentioned as a possible breakout candidate here is behaving extremely well and right now is one of my favorite stock charts to focus on.

There are a number of reasons why LVS is worth keeping as a permanent watchlist stock for short term and long term tracking.

  1. Liquidity -  Las Vegas Sands Corp. is an extremely liquid stock and it moves nicely and seems to trend smoothly, not to mention the fact that it has a very clean chart from a short term, and long term perspective.
  2. Smooth Trending – I already said that, but I say it again because it is a great thing to have in any stock.  In fact if you did not tell me the stock symbol LVS before looking at the LVS chart, I would almost think it was a currency price chart as they also tend to move in more reliable trends.
  3. Options Liquidity – It has heavy options volume and plenty of liquidity in that department as well
  4. Its Cheap! – Relatively speaking LVS is still a lower priced stock and can still make some big moves. 
  5. It is a nice way to play the contraction and expansion of the economy as discretionary income levels contract or expand.  Got a little extra cash? Well then of course! Lets go blow it all off at the casino and see if we can win big!
  6. The Marina Bay Sands Casino in Singapore (pictured above) is scheduled to have its grand opening on April 27, 2010 after Las Vegas Sands Corp invested 3.895 billion dollars on it.
  7. It is a proven business and not a China Stock that is just starting operations an unproven.  Don’t get me wrong, I like all the little China Stocks, but many of them recently have plunged 30% in a few days time because of ‘accounting problems’ and other crazy reasons.  China Stocks can move big but a lot of them are still unproven business models and still highly speculative.
  8. They have a ‘sky garden’ on top of the Marina Bay Sands Corp Casino! Man would I like to hang out in that park on top of those three large buildings! Totally AWESOME 🙂 If there ever was a place to take a woman out on a ‘first date’ that would be it !

Read more

AIB Allied Irish Banks and LYG Lloyds Banking Group PLC (ADR) Still Bullish

Both of these bank stock charts are still looking bullish to me for more potential upside in the week(s) ahead.  The attraction of AIB is that it is late in the recovery compared to many US banks, but still the price chart has some positive aspects to it in my opinion.

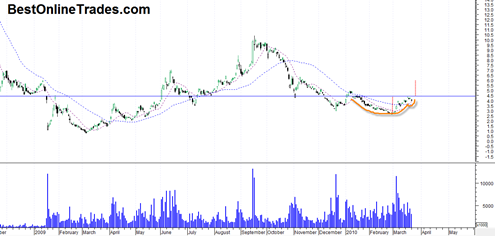
For starters, it has what looks like a double bottom that has about 1 full year distance between the potential bottoms.  The substantial distance between the potential bottoms is a good technical setup that could have a lot of potential significance from a longer term perspective.  The double bottom is not a confirmed double bottom.  I am just trying to make an ‘early call’ that it will be one as we go forward.

AIB appears to be testing a resistance range and has recently stalled there.  There is some slight resemblance to a cup and handle pattern developing that could send AIB to the 6 range assuming we get a northward breakout this week or next.

aib20100322

Similar to AIB, LYG Lloyds Banking Group, another ADR (England) appears also to have a quite bullish looking setup for a breakout north through resistance soon as well.

Read more

Las Vegas Sands Corp. (LVS) Weekly Price Chart Looking Very Good for a Breakout

lvs20100317

Las Vegas Sands (LVS) the casino and gambling co. has what I consider to be a very bullish looking weekly candlestick chart.  It is interesting that the basic structure here is somewhat similar to the way GE General Electric looks and GE recently managed to get a substantial sign of strength breakout on huge volume.

The challenge for LVS is to get a sign of strength weekly price breakout over and above the 20.73 level.  The price chart shown above has a lot of sideways cause and is a bullish sign for supporting an extended weekly breakout.

Assuming a breakout (perhaps next week sometime ?) a quick retest back to the 21 area would be expected and preferably on low volume.  The sideways pattern of the last 5 or 6 months resembles a saucer formation.

Read more