ANDS Anady’s Pharmaceuticals Possible Breakout Setup

ands20090811

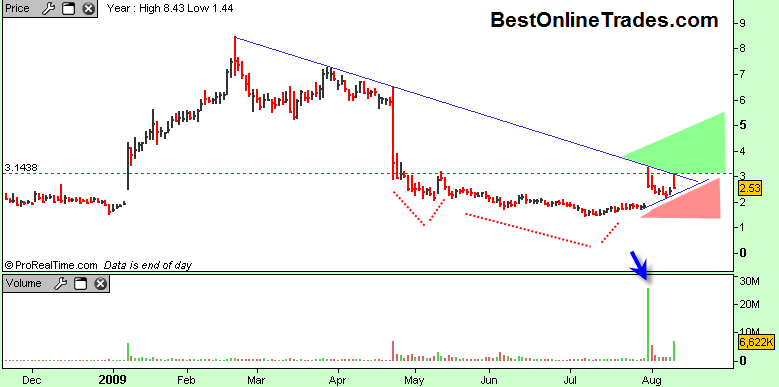
ANDS has had a couple recent big price moves to the upside, and the overall price structure is suggesting to me that ANDS could be setting up for a breakout.

After a brief strong run in the beginning of this year, ANDS went into a somewhat relentless decline to roughly 1.50.  It then had a pop up to the 3.00 range on blockbuster volume.  That pop was sold off intra day and today’s upside pop was also sold off intra day.  However the overall structure of ANDS has some notable and constructive aspects to it.

Although somewhat messy looking there appears to be a head and shoulders bottom formation with neckline resistance at 3.14.  The left shoulder was around 1st May, the head from mid May to end of July and the right shoulder the last 6 trading days.  If I am correct in identifying this head and shoulders bottom, then we could eventually see 4.50 as a target.

Read more

ERPLQ Energy Partners Limited may Breakout Soon

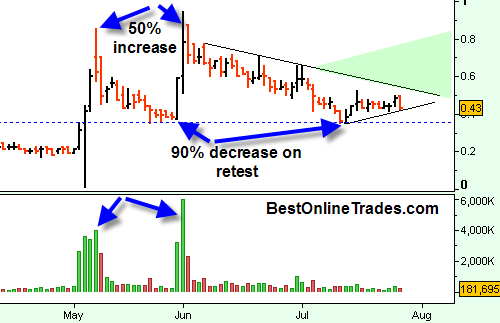
The market is taking a slight beating today but EPLRQ, a somewhat spotty and thin trade penny stock has a pretty decent pattern and may get a run going if it manages to consistently trade above .45. It pattern looks somewhat like a head and shoulders bottom formation with the right shoulder being much longer … Read more

DVAX Dynavax Technologies possible large Cup and Handle

DVAX20090803

Biotech stocks can be very tricky trades and very unpredictable, but I still thought DVAX was worth a mention as it appears to have a large favorable pattern also known as a cup and handle pattern.  The entire pattern is about 9 months in duration.  That is appealing just based on how long it has been forming. To me, a 9 month cup and handle is a lot more valuable than a 2 month cup and handle chart.

Anyway, it appears that the handle is almost done forming and we could see a big breakout type move out of this pattern, possible in August time frame.  One could also make the case that the handle portion of the DVAX chart is actually a smaller cup and handle pattern itself.  That is an interesting type of symmetry and something I do not see all too often.  It is a nice clear signal that helps to make for a clean move.

I really would not want to see anything below 1.74 on DVAX to keep this entire pattern intact.  If it does move below 1.74, then there could still be a case for an eventual breakout, but just for the sake of being ‘picky’ I think that is the standard that needs to be set here on DVAX.

Read more

US Steel X Almost done creating Inverse Head and Shoulders Pattern

It really is quite amazing. I feel like a kid in a candy store.  There are so many long side setups now that it is hard not to find one out there.  It is a result of the strong bullish persistence in the broad market as it rebounds out of the depths of its bear … Read more

PACR Pacer International Setting up for a Breakout

PACR

BestOnlineTrades recently developed a powerful new computer scan that scans over four thousand five hundred different stocks (Nasdaq and New York Stock Exchange).  It is a superb scan because out of that entire list of 4500 plus stocks it only returned 1/3 of 1% as viable candidates! (.27%)  And it typically seems to only return a maximum of 20 stocks each day.  That is extremely valuable not only because of time savings, but also because of the quality of the candidates it seems to find.  It is a custom scan I developed that uses a combination of two very powerful indicators.  One of them happens to be an indicator that the famous Jake Bernstein likes to use a lot.  But when used in combination with our own custom indicator, the quality factor goes up 5 fold.

PACR Pacer International is one of the stocks that came up in the scan and we are glad that it did, because it looks quite good to these eyes.  The few months to the left of this chart are also significant (not shown on the chart above) because in March PACR did a nose dive into the 1.7 range area, then it rebounded to the 5 level only to fall back where we currently are in this congestion area.

So one could say that the current retracement is a complex double bottom and now we have built sideways cause here for about a month and are perched just under the resistance line close to the mid 2’s.

Read more

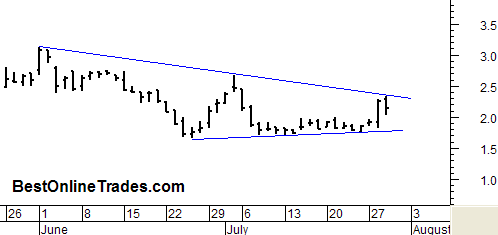
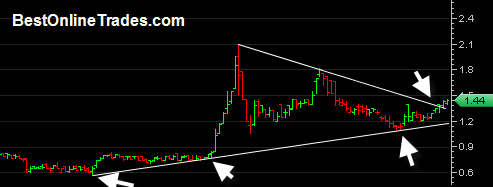
PLM Polymet Mining Corp Ready for an Uptrend ?

plm20090729

Polymet Mining Corp may be getting ready for some sort of uptrend here pretty soon.  If you look at the chart I can conclude a few things already.

  • It has held support on its uptrend line since mid March with 2 tests.
  • It has completed a consolidation of about 2 months duration.
  • It has broken through the resistance as defined by the white downtrend line.

So I think we might see a trickle of an uptrend on this one.  But I have to add that these mining stocks are not for the faint of heart.  In my experience they tend to trade with heavy retracements and cumbersome up trends.  And it makes sense that they trade that way because they are in the mining industry which in generally requires large equipment and investment costs and slow to market type products, especially when they are in the exploration stage.

Apparently Polymet wants to mine copper, nickel and other precious metals precipitate according to their website.  You know, I really wish all mining companies right on their homepage would say in very large text exactly what they are mining for, what their proven and probably reserves are, and when they plan to start production (or if they are producing right now how much).  That way it give the entire investment community an quick 1-2-3 idea of what they are dealing with.  Perhaps I am a bit lazy to dig through all their information myself but it just makes sense to me to provide that right up front especially for mining companies since it is one of the most important factors in their valuation.

Read more

Watching EPEX Edge Petroleum Corporation for a Signal

We are keeping an eye on Edge Petroleum Corp EPEX for a possible decision point in early August.  EPEX is a crude oil and natural gas exploration company.  So clearly the price of oil and natural gas is one factor in the potential future price of EPEX.

I did a brief post on the price of natural gas earlier indicating that natural gas as represented by the UNG ETF is slowly starting to form a bottom.  It probably has quite a bit more work to do at the lows for a clearer picture on a real trend change, but for now the first major guidepost for UNG is the July monthly closing price bar and then the follow through on the August price bar.

We already know that the price of crude oil has been able to get a substantial recovery rally going from the depths of its bear market lows.  Now if natural gas can start a similar trend, we feel it will be beneficial to EPEX.

More important than that however is the actual price action on EPEX.  Lets take a look at what it has been doing.

epex20090728 

Read more