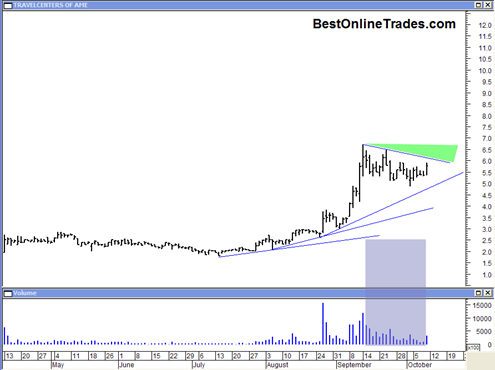
Travel Centers of America TA and NewCastle Investment Corp NCT

Once again the bulls completely own the show and gapped the market up today and closed very strong and on pretty healthy volume at least compared to what we were seeing before. I once again refer you to this chart of the SP500 that shows we still have some time left before we actually hit … Read more

I am Going to Run With the Bulls Again TA Travel Centers of America

Well for a little while anyway.  I am glad I finally recovered from my own personal ‘October scare’ watching the market last week and feel that I have at least half my sanity back now.  So I am gonna run with a bulls a bit more and see what I can find.

The bottom line is, if you show me a good chart whether it be a stock or an ETF, then it is worthwhile exploring if there is some potential regardless of what the rest of the market is doing.  It may mean that you have to use tighter stops to control risk, but might as well go with the predominant trend force.

A Stock is Never too High to Buy and Never Too Low to Sell

That is the quote from Jesse Livermore that I paraphrased a bit.  I don’t know the exact quote, but I am writing it again because I think it is a very important point.  But again, manage risk prudently and use tighter stops and closely defined entries.

Buying stocks ‘high’ is also referred to as ‘momentum trading’.  I believe statistically it may produce more winning trades than any other method for the simple reason that you are making trades along side the predominant force in the market and in many cases that force is likely to continue.

In the past I used to be afraid to trade momentum because I could not remove the blockage in my mind how scary it is to ‘buy high’.  Not anymore.

So that brings me to TA Travel Centers of America.ta20091009

Read more

LEAP Leap Wireless International May Be Set up for a 10% Upside Move

leap20090826

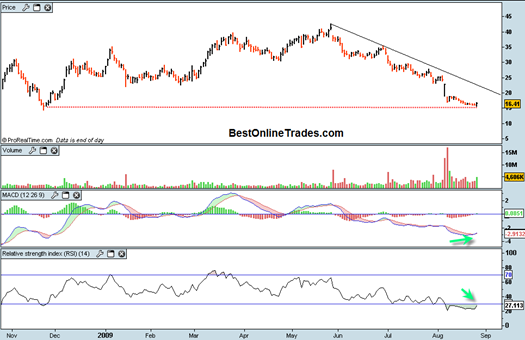
LEAP looks like a good setup to possible deliver about 10% returns starting from tomorrow in the AM.  I found leap by doing a stock scan of over 4700 nasdaq and NYSE stocks filtering for MACD daily buy signal and RSI less than 50.

Only 6 stocks came up from the scan because I had put the limitation that they should also be trading greater than 1 million shares.

LEAP looks good to me for several reasons.  It is doing a retest of an important late November 2008 swing low.  The daily MACD has extended to the downside and has given a bullish cross.  Relative Strength Index is very oversold and looks like it will soon give a buy signal.

Read more

CBL CBL & Associates Properties May Get a Cup and Handle Breakout Soon

CBL looks like it has a cup and handle setup and if CBL can get a price move above 8.80 I think we could see breakout type action and a continuation uptrend. CBL probably should have been the first stock I mentioned today.  All the others I have talked about so far today are not … Read more

Citigroup Inc. (NYSE:C) Delivers a Confirmed Volume Breakout

citigroup20090821

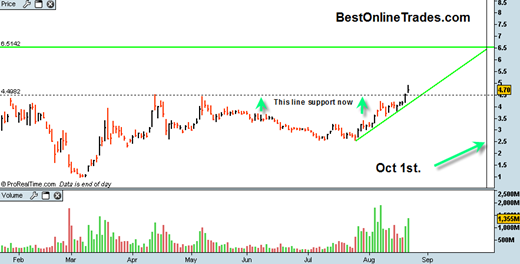
The pressure was on Citigroup to deliver a breakout above the 4.50 level on greater than 1.22 billion shares.  Citigroup delivered handily today with a nice sign of strength breakout on 1.35 billion shares.

Now the 4.50 level becomes new support and there still exists this bright green up trend line which should help support price into the 6 to 6.40 range which I consider to be an ideal target and eventual exit point.

Read more

CTIC Cell Therapeutics Still Holding Above Blue Resistance Line

There is not too much new to say about CTIC today other than the fact that it is still doing what it is supposed to do.  CTIC held above both the original blue longer term resistance line (which is now support) and it also held above the shorter term red minor trendline.  This is important … Read more

C Citigroup has an Outstanding Bullish Setup

citigroup20090820

It seems I have spent so much time focusing on a lot of really cheap and speculative stocks here at BestOnlineTrades that I haven’t been able to see the forest for the trees.  Well I saw the whole forest today and Citigroup jumped right out at me.

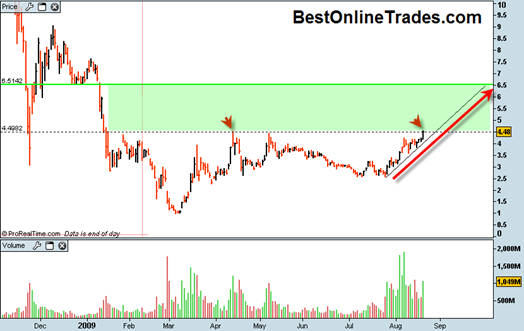
Citigroup looks like a really good setup to me right now.  Even though it has already rallied the last few weeks we have closed on August 20th right at the previous resistance line.  The volume comparison between the two swings noted by the red arrows shows a decline of about 13%.  That may be a sign that we get a minor pull back tomorrow, but I think Citigroup is going to bust out topside from this 4.50 resistance level and head on towards the 6 to 6.50 range perhaps during the next few weeks.

Read more

CHB Champion Enterprises Setup Looks Good

chb20090814

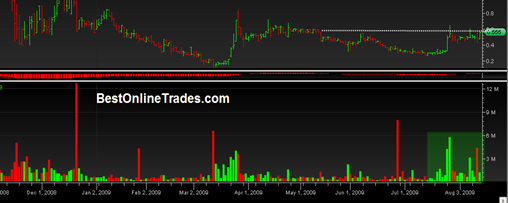
CHB Champion Enterprises has had some big volume come in recently (shaded in green on the stock chart above, click on it for full size).  And it is looking like a big move could be coming to the upside.

After a brief multi day spike up in March CHB has not really participated at all in the broad markets super rally.  After that spike up in March CHB pretty much has drifted sideways in what I consider to be a very long consolidation.

It drifted down in mid July in what appears to be a final bottom for CHB.  What is significant is that CHB did not continue to break down to retest the lows of March.  This is important because it is a hint of at least some strength in the stock and says that CHB is strong enough to resist a full retest.  It is good bottoming action I like to see.

Even more significant is that now CHB has had a big surge in volume come in on the recent advance and price seems to be consolidating in a sideways triangle type formation.

Read more

ANDS Anady’s Pharmaceuticals Possible Breakout Setup

ands20090811

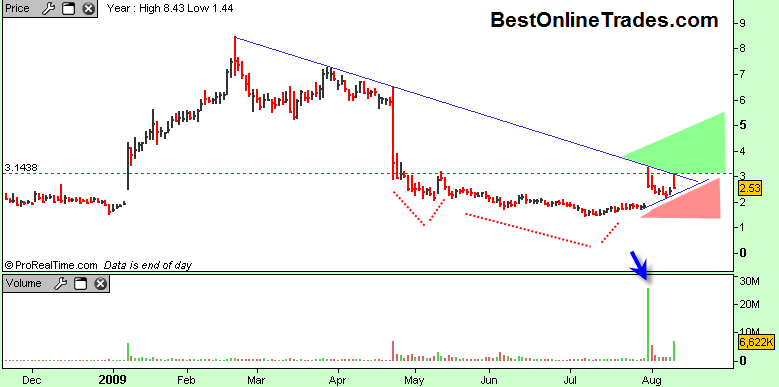
ANDS has had a couple recent big price moves to the upside, and the overall price structure is suggesting to me that ANDS could be setting up for a breakout.

After a brief strong run in the beginning of this year, ANDS went into a somewhat relentless decline to roughly 1.50.  It then had a pop up to the 3.00 range on blockbuster volume.  That pop was sold off intra day and today’s upside pop was also sold off intra day.  However the overall structure of ANDS has some notable and constructive aspects to it.

Although somewhat messy looking there appears to be a head and shoulders bottom formation with neckline resistance at 3.14.  The left shoulder was around 1st May, the head from mid May to end of July and the right shoulder the last 6 trading days.  If I am correct in identifying this head and shoulders bottom, then we could eventually see 4.50 as a target.

Read more