Sp500 on the Brink of Holding Channel Support or Busting Back Inside

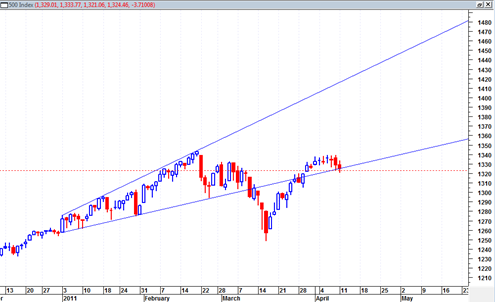
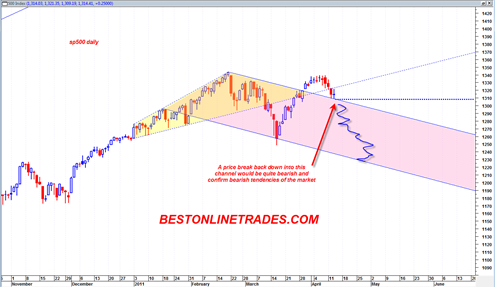
If the sp500 trades a full price bar below 1309 tomorrow with 1309 as the high then it will be trading back inside the bearish trend channel and make the recent last 2 to 3 weeks a ‘false breakout’ above the channel.  This would be quite a bearish situation and further confirm the bearish trend.  Today the price formed a doji or pausing candlestick that seems to have tested the underside of the broadening wedge line.

A gap down opening tomorrow starting at 1309 would certainly do the trick to clue in that we are about to break back inside this channel.

Still, there is still an opportunity for the market to trade bullish in the current range.  If the sp500 trades sideways or up, with today’s low of 1309 as the final low then a bullish picture could emerge from here.  An added reason for a potential bullish move out of here is the lack of heavy downside volume.

We do not have to break back down into the bearish channel tomorrow, but it would certainly help the current bearish possibilities of the market.

sp50020110413

Read more

Here is a Possible Crash Scenario for the sp500

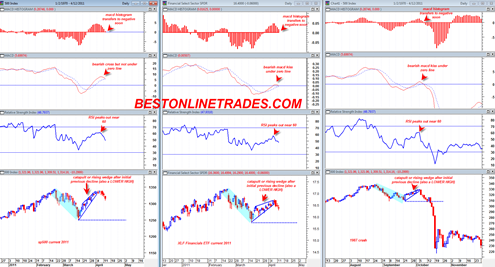
Here at BestOnlineTrades we like to consider a realm of possibilities for the market at any one time.  Sometimes they are bullish, sometimes they are bearish, and sometimes there exists a very remote possibility of a stock market crash.

So, after reviewing a few charts of the sp500 in the current time frame and the 1987 time frame and then also the XLF financials ETF, we see that there is a possible window for a crash to develop. 

These types of setups can occur a few times every few years and 99% of the time they fail and do not lead to the massive volatility of a stock market crash.  Still, I like to display and consider possibilities, but am well aware that bearish expectation must be kept under control and ‘tempered’ significantly depending on price action developments.

In some cases a posting like this can be a strong contrary signal!  (in other words meaning that we may have hit bottom).

However at this time I do not see much expectation for a big drop in the market.  In fact when we get a reactionary rally back up to the old 52 week highs, it tends to really discourage the bears and short sellers and squeezes them out, sometimes leading to a new decline that becomes very persistent because of their lack of participation and short covering.

Read more

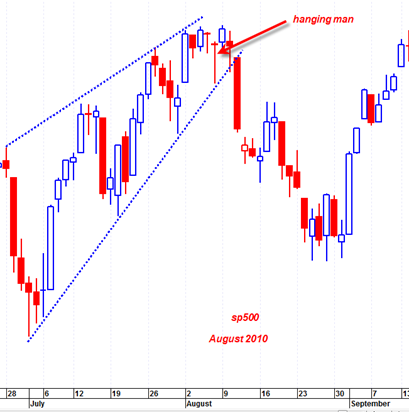
The Most Bearish Monthly Hanging Man Candlestick in 41 Years on sp500

Sometimes you have to stare at your price charts a little bit longer to understand the real potential magnitude of what you are dealing with.  Sometimes hidden clues in the charts only make themselves known until extensive contemplation and study.

BestOnlineTrades continues to push the limits of proper interpretation of these markets and we continue to focus on interpreting price action across multiple time frames.  Only those who are able to interpret the price action properly across multiple time frames stand the best chance at understanding future market direction.

I was recently reviewing the monthly candlestick chart on the sp500 and it seems pretty clear to me now that the March 2011 monthly price candlestick is ‘potentially’ the most bearish monthly hanging man candlestick we have seen since in 41 years on the sp500.  My chart data on the sp500 only goes back 41 years, so there could be a monthly hanging man that looks just as bearish as the March 2011 candle, but at least going back to 1970 I have not seen any with as much bearish potential as this one.  In other words I have not seen in 41 years a monthly hanging man with such a LONG bottoming tail and a clean body with almost no top candle wick on it.

This monthly March 2011 hanging man candlestick is potentially very bearish because it has all of the perfect elements that make for a potent hanging man candle.

Read more

Bearish Weekly Trend on sp500 May Start to Gain Momentum Again

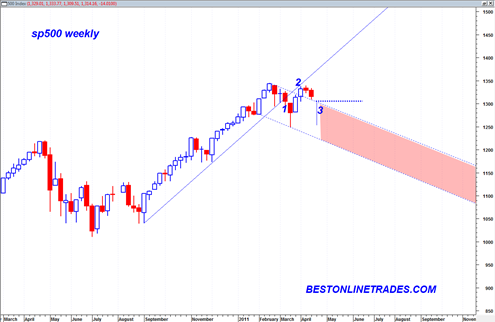
I think evidence is starting to pile up that the weekly sell signal given in early March 2011 is now starting to re establish itself.  There is a confirmed weekly MACD sell signal based on the MACD weekly histogram today, but we are only two days into the week.  This signal can still reverse itself during the next 3 trading days.  If it does not then of course the weekly confirmed sell will remain intact.

The downside volume in the SPY was actually quite average today and I am not quite sure whether to interpret this as complacency or a sign of a weak bearish attempt.

The advance since the 3/16/2011 high volume swing low appears to be a rising wedge formation that has pressed back up to the old highs.  Up at the old highs we recently saw several doji candlesticks which marked an indecision point.  Now the market has turned down again, although not to an extreme. 

sp50020110412

Looking at the weekly chart we can see that the weekly up trend was broken with high volume at (1).  Then we had the two to three week upwards rally back under the up trend line to (2) forming several daily doji candlesticks.  But now so far this week we are retracing down a bit and today we touched the top of this large declining channel.

Read more

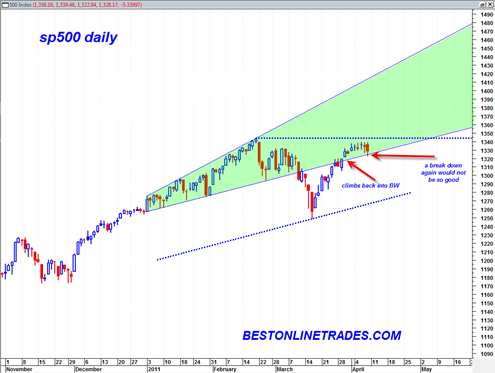
sp500 Flirting with Broadening Wedge

The sp500 is drifting slightly down to sideways and is again flirting with the boundary line of the large broadening wedge formation.  We did not close below the broadening wedge line today but came pretty close.

A close under 1323 this week will confirm a weekly bearish MACD histogram signal and I really do not know if that will happen this week.  But I will say that if we close down hard tomorrow that likelihood will start to become more probable.

This is a tough area of the market.  A big move up tomorrow would ‘save’ the market to a certain degree and keep it trending within this broadening wedge.

I think it good to keep open minded about the possibility that we are trading range bound now between 1340 and 1250.

If the current consolidation fails and starts to break down tomorrow it could be that we are going to make another move towards 1250.

The March 16, 2011 SPY volume was 470 million shares, a very high spike volume number showing heavy price action, participation and capitulation.

The rally since that swing low has drifted back up to the highs and seems to be struggling.  It would not be so uncommon for a retest of this high volume swing low on March 16, 2011, assuming we fail to push higher anymore on the current mini consolidation.

Read more

Tricky Analysis Currently in the sp500

I have to say that currently the analysis of the future direction of the sp500 is quite ‘tricky’.  I am thinking that I can make equal arguments for the short term bull or bear case.

There are several reasons for this.  One reason is that currently the weekly MACD on the market is on a sell signal and I have been waiting for the market to provide a northward confirmation of the weekly MACD histogram buy signal.  We did not get any confirmation this week.

Instead, on the weekly chart of the sp500 we now have a potential bearish triple M on the weekly MACD histogram which is unconfirmed.  This means that the bearish weekly potential trend could be re confirmed on a weekly close below 1333 on the sp500.

There is also the issue of the overhanging supply from the 2/28/2011 top.  It is unknown at this time how much supply still has to be worked off of this level.  We are seeing the sp500 trade in dojis and then some selling today to work off of this supply, but it is a tough call to say that we are finished working it off, we may not be.  The NYSE summation index seems to be at a resistance zone and may start to stall here.

You remember that expanding broadening wedge formation in the sp500

As it turns out, we have currently climbed right back into that large broadening wedge formation…

Read more

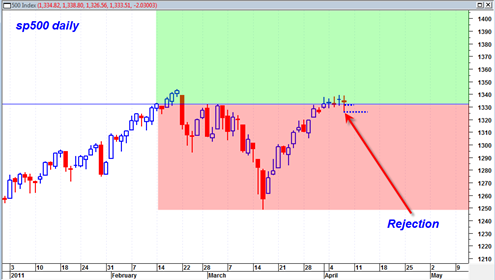
sp500 Does a Sound Rejection of under the 1332 Level Today

Today my take on the market is that the sp500 did a quite sound rejection of below the 1332 level.  The bears had every opportunity today to seal the deal and get this baby of a market to CLOSE down town below 1332 AND at the same time confirm the recent cluster of doji candlesticks we have seen for the past several days.

Did they get the job done? In a word.. No.

The sp500 dipped its toes into the still icy cold early spring water and decided not to jump in today.  Instead we closed back above the 1332 range and now gives the market at least a chance of trending higher again either tomorrow or early next week.

Having said that, today’s reversal hammer would prove itself even more if the market can get a pop above it tomorrow to finish the week.  That would not only confirm the power of today’s rejection, but it would also give the market a shot at confirming the weekly bullish MACD histogram setup which is still as of today unconfirmed.  Confirmation would come with a close above 1337.85 on the sp500.

Read more

Yearly Sp500 Guide Posts

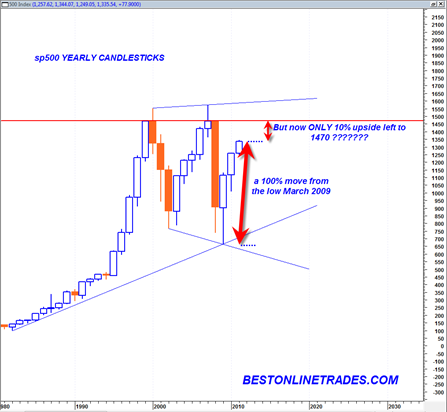
The yearly candlestick chart of the sp500 is indeed one of the most powerful technical analysis charts in the current multi decade time frame.  The yearly time frame is the maximum time frame in technical analysis and identifies massive bull or bear markets and massive support and resistance levels.

What we can see from the current yearly sp500 candlestick chart is that the sp500 has been trading in a massive trading range since the year 2000.  Before the year 2000 was a raging bull market in equities, a slow and normal trending market.  That was the mega bull future generations will look at in total awe.

But since 2000 the market has been in a highly volatile trading range state.  We see now that the sp500 has been trading the last 3 years (including this year) in an upward recovery trajectory.

For longer term purposes I think it is very prudent to look at the context of the sp500 now within this large trading range.  The fact is that since the March 2009 low of 666 in the sp500 the sp500 has traded higher until today on the order of 100%.  That is a huge move.

The percentage move from the LOW of 2009 to the HIGH of 2009 was about 70%.  The percentage move from the LOW of 2010 to the HIGH of 2010 was about 25%.

Currently the LOW of 2011 is 1249.  A move to 1470 would be about 17.5%.  But a move from the current level of today to 1470 is only about 10%.

Read more

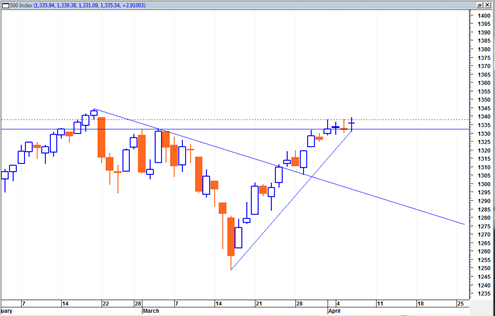
sp500 Resting with 3 Doji Candlesticks

The sp500 during the last 3 trading days has printed three doji candlestick formations.  For now I suspect that these three dojis are just a simple pause in the up trend.  There has so far been now hard down reaction after any one of these dojis.

I have seen several dojis like this cluster before and at least in recent memory a lot of them have simply meant a pause in the trend describing a pattern where prices imply drifts sideways to rest and then finds the uptrend for a new move higher.

The Russell 2000 is already well into new high ground, the DJIA is trying to push to new highs and the sp500 is slightly under the old 52 week high.

I do not see anything immediately bearish about the McClellan summation index at the present time.

I can see the Russell 2000 supported on a pull back to 838 and the DJIA on a pull back to 12260.  The sp500 is still trading above the near term support of 1332 now.  Ideally for the near term continued bullish case it would keep trading above this level either sideways or only slightly down.

sp50020110406

Read more

sp500 Working on a Weekly MACD Histogram Buy Signal

The sp500 today formed a doji candlestick which simply means we are either at a pausing juncture in the short term or a reversal juncture.  This doji today formed after last Friday’s ‘false shooting star’ candlestick.  I call it a false shooting star because the topping tail was not long enough and the close was not bearish at all.

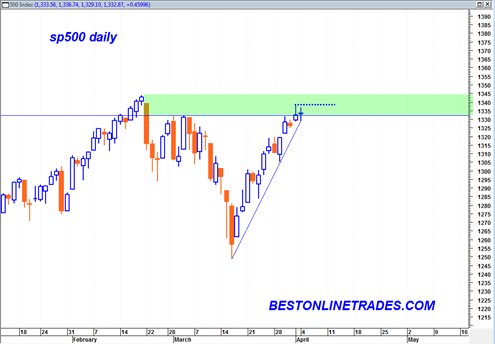
The sp500 has not closed into this green shaded zone that I have referred to several times before.  The green shaded zone is simply a close above the 1332 range which puts the market in an area of much less resistance.  We could easily close back under that zone again depending on what mood the market is in the rest of this week, but for now it appears that today is simply a pause in the uptrend and that we are on our way eventually to new 52 week highs in the sp500.

As pointed out in a previous post, the Russell 2000 is already at this stage, as well at the Dow Transports and maybe a couple other indices.  Certainly it is not a guarantee that the sp500 will do the same, but it does appear now quite likely given the behavior of other leading indices.

Read more