BestOnlineTrades Nails the Low in the Market Again BOT Signal Chronology

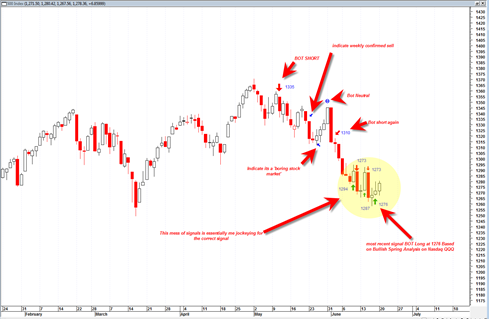
After today’s price action in the sp500, it appears once again that BestOnlineTrades dot com has nailed the low in the market with a good amount of precision.

We do not claim to be perfect here at BestOnlineTrades.com.  We do not pick perfect bottoms and perfect tops, but we know how to read the tape and follow the price action and the volume resulting in occasional powerful long or short signals in the sp500.  During the last few weeks I have barely followed the economic or fundamental news.  I do not watch CNBC or read Bloomberg any more.

I would say that my exposure to business fundamental news stories is almost non existent.  I follow the tape 99% and maybe occasionally get 1% exposure to macro fundamental news (sometimes it is just impossible to avoid, ie. driving in the car and hear news summaries between commercial breaks etc.).

In fact, I would say that my lack of exposure to fundamental news stories and lack of interest in them puts BestOnlineTrades at a very key competitive advantage relative to many other market timers and newsletter writers and other traders.  Why?  Because I am making my decisions based solely on the tape action and the volume.  Not just that, but also the interpretation of them minus any news bias.

Read more

Important Long Term Ultra Bearish Scenario for sp500

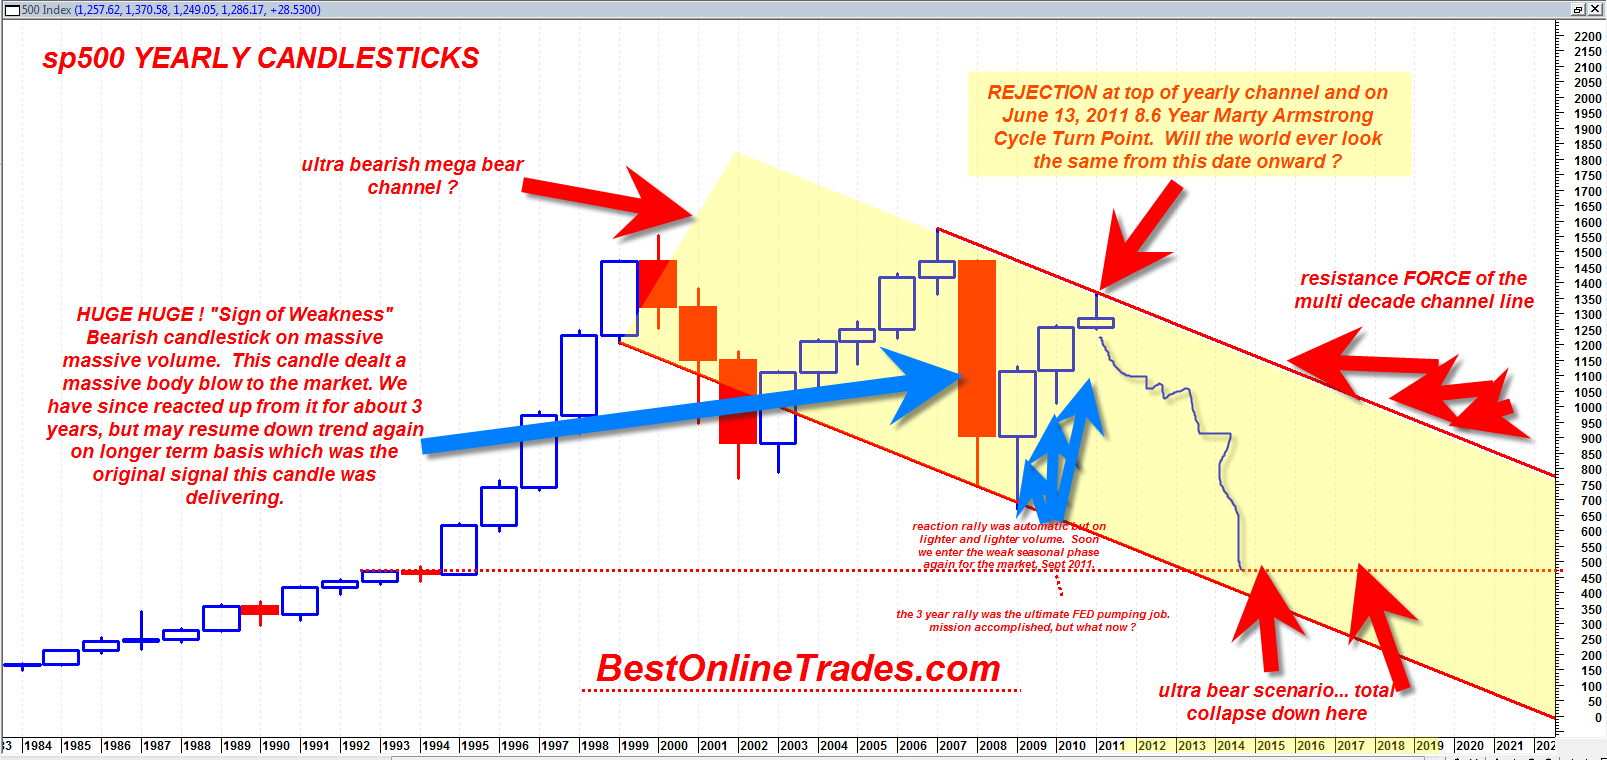
The chart you are about to see below may be one of the most important sp500 charts I have ever created with possible dramatic implications for the next 5 to 10 years.  This long term chart is much different than the other longer term multi year charts because this one shows a down trending channel.  My previous multi year chart shows a massive horizontal channel which is still valid.  But the horizontal multi year channel implies a simple trading range instead of a mega bear channel.

The very long term chart of the sp500 on the yearly basis shows that there exists the possibility that we are not hitting the top portion of a mega yearly channel right on the Marty Armstrong Cycle turn date and that this turn could mark the beginning of a multi year down move back to the bottom of the channel.

If true then it would put the sp500 eventually near 450 by 2016?  That is an extremely rough guess.

Read more

BOT Short Signal at 1310

I am putting the BOT short signal back on again on the sp500 at 1310.  The bounce is not arriving and I would rather put the signal on now.  Whether we bounce 10 or 20 sp points from here seems to be a mute point for now. Yesterday was a HUGE sign of weakness and … Read more

8.6 Year Marty Armstrong Cycle Turning Point Starting to Unleash its Power

Today’s action in the sp500 has me thinking the 8.6 year cycle model turning point I have been talking about ad nauseam for months now is starting to take effect and turn this beast of a market into a sideways to down market.

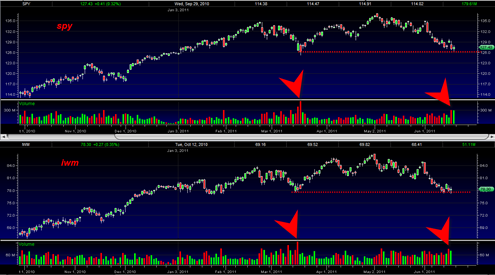
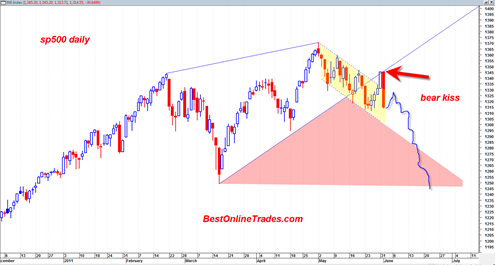
Today we saw the sp500 blast back under the tight channel I have been referring to and did so on robust volume on the SPY ETF.  This was very bearish action today.  The breakout from the channel yesterday was false.  The market re asserted itself to a bearish trend today.  This should keep the weekly bearish trend going again and continue to manifest the possible weak or weakening monthly trend.

I think it quite possible that we are at a very important top in the market here.  It is no coincidence that this turn action is occurring only a week or two from the June 13, 2011 cycle model turning point.

In yesterday’s post I pointed out a very large possible structure on the Dow Jones Transportation Average that could take the shape of a massive head and shoulders bottoming formation.  If true then we could see some hefty declines in this index to create the right shoulder of the pattern.

Even if we are at a major top here in the sp500 I expect it to be choppy.  Tops take long to form and are messy at the top.  Just look at the 2007 top and how long it took to fall apart.

Read more

sp500 Breaks out North from Short Term Trading Channel BOT Neutral for Now

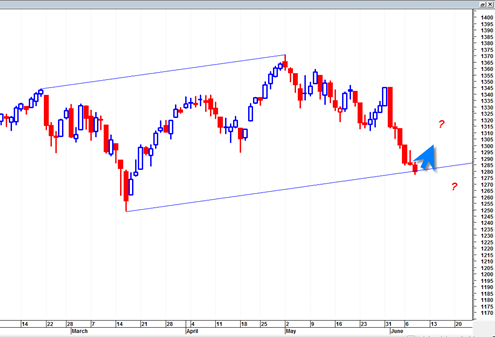
The sp500 today broke out north from the tightly compressed downward sloping trading channel we have been working through the past several weeks.  The market appears to want to move higher again to a new 52 week high eventually.

At this point this is a clear long signal again, but I am holding off switching to BOT long signal and instead take a wait and see attitude on whether the market can make a new 52 week high.  We are only about 8 days away from the June 13, 2011 cycle turning point of Marty Armstrong and I would rather wait and see if any type of turn occurs on or near this date.  This is partly why I am just switching to neutral for now.

You know the old saying ‘a wolf in sheep’s clothing’.  Well in this case the wolf is the long side and the sheep’s clothing is the neutral side.  Basically I believe the long signal is correct going forward again, but I would rather bide my time and stay with neutral until I see true northward confirmation.

Put simply, I want to see full sp500 price bars above 1370 before switching back to long signal.  That should be more than enough time to see what, if any, effect the 8.6 year cycle point has on the market.

Read more