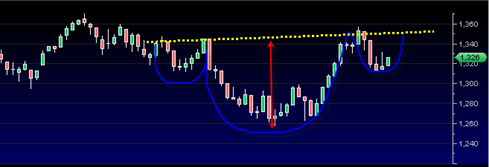
In my previous posting I put forward a mini trivia question on a portion of price action in the sp500 that shows what appears to be a bullish inverse head and shoulders pattern. But is it really bullish?
I have pointed out in some past posts that inverse head and shoulder patterns that form near the very top of a market advance are probably less favorable than inverse h&s patterns that form after an extended market decline. I do not have statistics to back that up, but it seems like a natural conclusion simply from a risk reward standpoint where price is trading in the phases of a trading cycle.
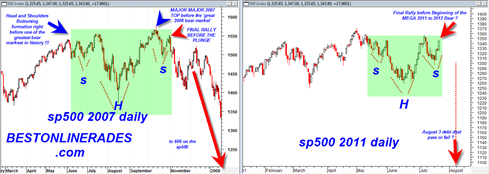
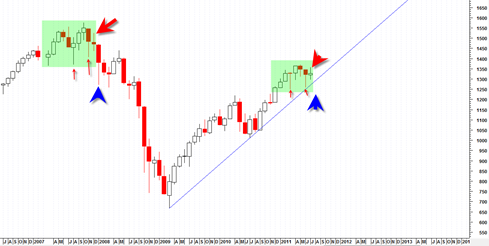
So the answer to the trivia question is JUNE TO OCTOBER 2007. What is important about June to to October 2007 ??? This period was the final top of the period 2007 and right after the inverse head and shoulders pattern completed the market went onto dive into one of the greatest most devastating bear markets in market history.
Curiously we now have another inverse head and shoulders bottom in the sp500 in the 2011 time frame with a debt deal as an apparent deadline for market deciding type action. It would seem we are at almost the same juncture in terms of pattern similarity.

