What is the Current Trading Psychology?

In a word. Thoroughly confused.  I can still see the broad market trending higher maybe even for the rest of September.  The price action continues to show little interest in breaking down.

What is bothering me is that I started following Larry Pesavento’s forecasts recently and he keeps talking about a big market drop that is supposed to happen soon and happen suddenly and that will eventually break the March lows.  It has screwed up my own psychology of the markets because I have been generally bullish and am still seeing enough bullish setups in individual stocks.  The market still has not given signs it wants to start a major downward trend change yet.  So why try to pick a top?  It just seems fruitless at this point.

The monthly SPY price bar so far rejected the lows and now appears to want to expand topside.  To be sure, when the REAL correction comes it will come suddenly and a good portion of the damage will happen in a matter of hours.  But until that point comes I am still bullish on this market!

The entire rally we have had since the March lows has been on lighter and lighter volume.  This is a warning that eventually a nasty correction will start but the problem comes in trying to pick a top.  Low volume rallies can seemingly last forever sometimes.

There is a gap on the SPY ETF that would be filled if the SPY hits 107.41.  It is possible we are going to go up there and fill that gap in the days ahead and then turn around from there.  107.41 is not that far from where we are today on the SPY.

I am also seeing a possible triple bearish divergence developing on the SPY ETF.  It will probably take another week or two to develop but it is worth keeping an eye on.

In the meantime I am still focusing in on ABK because I think ABK at least has the chance of being a blockbuster trade, maybe even better than the gold and silver breakout.  I like gold and silver but the problem is those markets can take forever to move.  I want to try to find something that moves soon and moves big.

Read more

What I saw In Gold and the SP500 Today

The SP500 closed right near the highs today but the volume was lousy.  I have to say this is a pretty amazing accomplishment given that it is a lazy Friday right before a 3 day holiday weekend.

The gold price also barely pulled back today and managed to close slightly positive on the daily basis.  This is a very bullish sign on a near term basis and says to me that the gold market could get some significant continuation next week.  The longer we hug the recent highs without pulling back that much, the more bullish potential we have for the long awaited break over 1000 !

But there is talk that the broad market is supposed to tank big time next week. I can see this as a possibility when I consider the huge downside volume that we had 3 days ago in a serious sign of weakness.  Yes we bounced higher today and closed right at the highs but it was on barely any volume.  It was all smoke and mirrors.

But I do have to respect the fact that we bounced off of support and now are bouncing back topside.  It just seems like the bears should have been able to accomplish more downside this week but they couldn’t get it done.  If they can’ t get it done next week then it could very well be that we are headed for more super bullish upside prices.  In a previous more longer term post on the sp500 I mentioned a scenario where this could be possible.

If this market is going to get a serious downside correction then I would think we get a gap down on Tuesday in the AM and then just slide down from there.  If we are still drifting around next week, then I am going to become more and more skeptical of the ‘super duper correction’ in September scenario.

Read more

S&P500 Finally Starts a Real Correction

sp50020090901

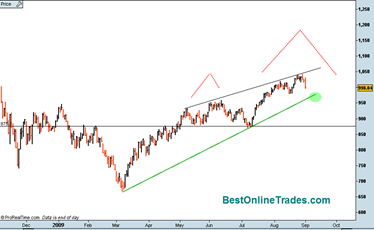
There is no doubt about it, the SP500 finally started a more serious correction today.  It was able to evade this correction for all of August but the shorter term bearish divergence was hinting that some sort of down move was in store.

You can clearly see from the chart that the SP500 is confined by the longer term green up trendline and the top black channel line.  It appears that we want to trade down now and test the bottom of this channel.  It is going to be important for that green up trendline to hold price during the month of September otherwise it could warm of a more involved correction that may see us trade down to the 870 range. 

But for now I am going to assume that the green up trendline holds support.

I also sketched in a couple of red lines on the chart pointing out the possibility at least that a somewhat large head and shoulders topping pattern may develop if we continue to correct down to 870 on the Sp500. 

Read more

Larry Pesavento Says the Market Goes Down Big Starting Next Week

Larry P, a superb trader who uses precise Fibonacci pattern analysis has been talking about the market being at an important top starting end of this week and beginning next week.

Larry P is also the one who made one of the greatest market calls I have ever seen.  During the October 2008 period he precisely called the worse declining portion of the ‘crash’ at that time.  I believe it was October 6th to October 10th, 2008.   Larry P is also heavily into Astro Trading and uses precise planetary alignments to pinpoint turning points and continuation patterns in the market.

The time frame of October 6th to 10th 2008 was a similar astro configuration to the one that existed in 1881 during the banking panic at that time.  So the planetary aspect that he was talking about was almost the same and existed over that period of 4 trading days.

Those 4 trading days led to huge price destruction and volatility during 2008 and the rest they say is history.

When I look at the SP500 I can see the possibility of a break down coming soon.   But I have said before and I will say it again… We need to break down under 1012 to 1014 as a first sign that we may be heading into a more severe correction.  When and if a correction starts it may happen very quickly to start it off as a big sign of weakness. 

Read more

I Can See the Future and it Looks Like the 1974 S&P500

1974monthlysp500

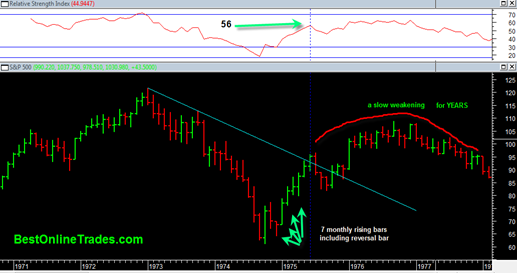
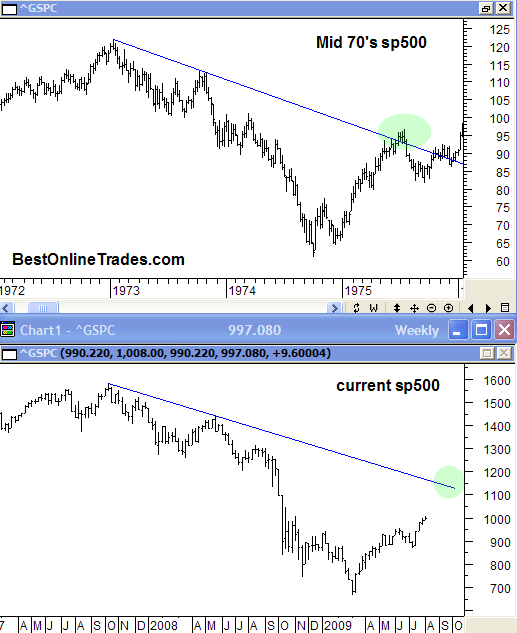
I don’t have a crystal ball that tells me what is in store for the future.  But the closest thing to a crystal ball that I have found so far is the 1974 time period of the S&P500.  The entire structure of the market during the time frame of 1968 to 1982 has given me a lot of good perspective and understanding about our current market and has helped to give me great clues and better confidence about where our current S&P500 may be headed in the future.

Now you may be asking yourself, what on earth does 1974 have to do with today ? Nothing actually.  But what I have found over the years is that sometimes past market movements tend to rhyme and show similar structure and trend development.

Read more

Emini S&P 500 Futures Down Significantly this Morning

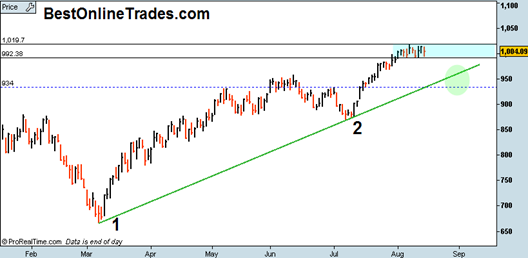
sp50020090817

The Emini S&P 500 Futures are down by over 20 points this morning.  That is the most I have seen them down in the morning for maybe the last month or so.  So it seems we could finally have a real correction to the downside kick in during the last two weeks of August.

I am still seeing a decent amount of upside setups, but this possible downward bias in the S&P 500 the next couple of weeks is worth noting and probably makes it prudent to be more defensive and shorter term the next couple of weeks.  There may be more failure breakouts and continuation breakdowns in individual stocks and the indices for the rest of August.

Read more

Is a Sideways Correction the Worst the Bears will Give us?

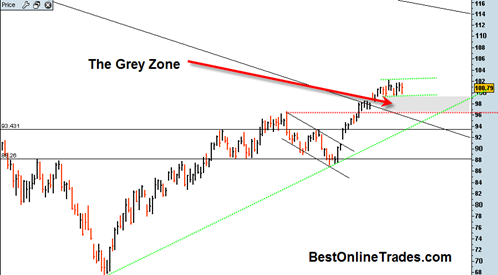
spy20090814  The SP500 was down on this Friday the second week of August.  But am I surprised? No. Not really.  This is about the time that traders head for the beaches. Plus it is starting to get way too hot and humid outside to be sitting in a room in front of the computer all day.  So a good bunch of them probably just sold to cash today and headed for the beach or the pool or for their favorite ice chilled beverage of choice.

All the bears could manage today was another down day within the smaller green channel I have drawn in the chart.  I am still open to the possibility of 95 on the SPY ETF as a normal corrective retracement and testing of the breakout area.  It would get us into the ‘grey zone’ so to speak and help correct off some excesses.

Read more

SP500 Index Starts a Retracement

sp50020090728 The SP500 looks like it wants to get a retracement going.  Currently I am thinking somewhere near the 950 level as I mentioned before being minor support and normal in the sense that often one will see price retrace right back to the breakout area.

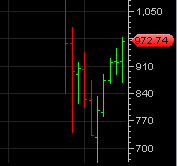
Also under consideration is the fact that we are only a few days away from the end of the month of July.  The little chart to the left shows monthly price bars on the SP500 index.  So the next opening price and initial price action for August will soon be printed on that chart.  It is possible, but unlikely in my opinion that the opening and continuation price for August will just easily continue at and above the 972 or higher level.  So instead I think we should see more of a retracement into the current July price bar for maybe the last few days of July and and then some days into August.  Then after that is complete a resumed move higher.

I am also noticing at least the possibility of a bit of a US dollar bounce upwards and that could stir some headwinds on the SP500 shorter term.

A modest price pullback during this time of year would not be extremely unusual.  We already know that the SP500 was able to make a valid break of the recent highs with adequate volume, so a retracement starting now is not the end of the world.

Looking at a price chart on the monthly scale has been very useful to me recently when you look at it in the context of what kind of range the next succeeding price bars will have.  It helps to quantify what the probabilities of the next price move is.

I should add also that if the SP500 were to continue upwards at the same rate as the last two weeks then we would quickly be close to SP500 level of 1100 within the next 2 weeks which seems highly unlikely, though not impossible.  So the upwards rate of change just got a bit ahead of us here.  So now I believe we will be in retracement mode. We shall see.

Read more