They Do Ring Bells at the Market Top

493px-Taco_Bell_logo.svg

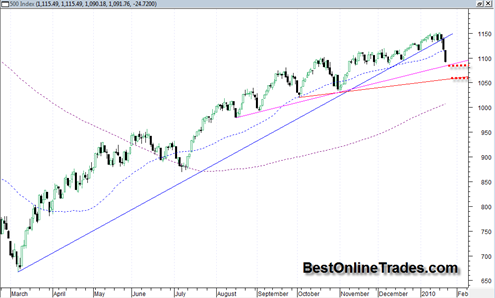
I am more confident than I have ever been in recent months that today’s action in the markets (SP500, DJIA, Nasdaq etc. ) marks the beginning of a much longer consolidation/correction phase than we have seen since March of 2009.

I am still long the TZA and plan to stay that way as a core short position for at least the next 3 to 4 weeks.  I have a game plan and will tell you about it shortly because I still feel as though I have somewhat of a ‘cheat sheet’ on this market. 

Anyway, here is a brief summary in bullet form the reasons why I believe a long corrective phase is at hand that should see the market decline between 10 to 15% from the recent highs…

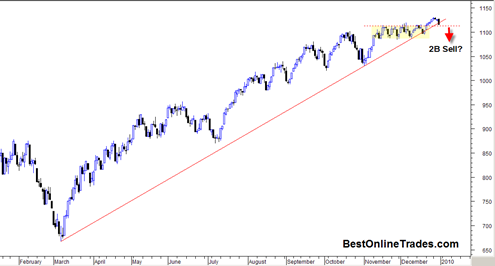
  • The SP500 has broken decisively the very long bull market up trendline that has been in force since March of 2009.  This was the high angle up trendline that has defined this bull trend and it was broken very decisively with a wide price spread and very high volume especially in comparison to volume levels of the last month or two advancing rally.
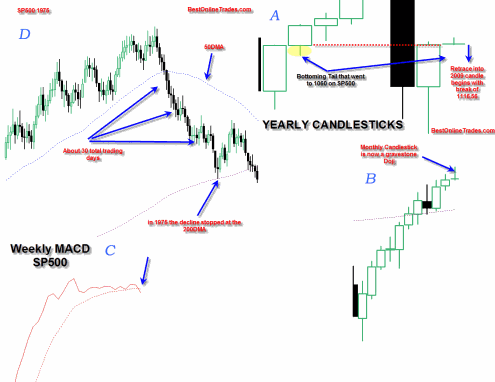
  • The WEEKLY MACD has finally confirmed a bearish downside crossover today which means that now the price trend should transfer to a “3 steps down 2 steps up” type action.  I have mentioned the weekly MACD many other times in previous posts and each time it looked like it was going to do a bearish cross, it them reversed and stretched itself out and evaded the sell signal.  But this time it failed to evade the sell in a big way especially when you consider the heavy volume and wide price spread to go along with it.
  • The Monthly January 2010 candlestick bar on almost all major indices has now transformed into a very bearish looking reversal hammer ( which implies that February will likely see the majority of the most devastating downward price action).
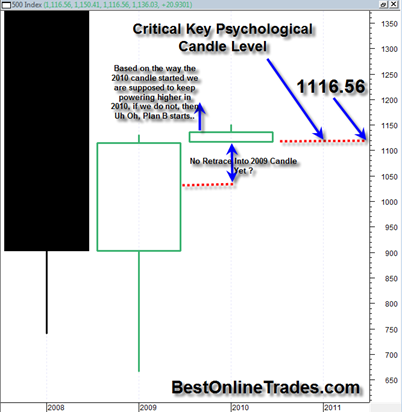
  • The YEARLY 2010 candlestick has now transformed into similarly very bearish looking gravestone doji.  The yearly 2010 candle now very clearly to me is saying the market wants to do some price retrace down into the 2009 candle.

Those are the main points that give me confidence on this trend change.  Now onto the charts…

Read more

Did you Know this Fact about the SP500 ?

Of all things technical analysis, I also enjoy pondering the longer term charts.  They cannot really be traded on, but they kind of give you this ‘I am the captain of this ship’ type feeling.  The other nice thing about them is they help to filter out all the shorter term ‘trading noise’ that exists in the shorter time frames.

I don’t look at the super long time frames that often but I usually do when the calendar changes to a new week, month, quarter or year.

The fact I am talking about on the SP500 in the title of this article is that the current YEARLY OPENING PRICE is exactly equal to the current YEARLY LOW price.  I had mentioned this one other time before but it is worth mentioning again because in terms of candlestick analysis it is very important.

I am embarrassed to admit that only until recently have I started using candlestick charts exclusively.  I was using regular bar charts for the longest time and never really shook the habit.  Perhaps I was just stubborn.  But I can tell you with zero doubt that understanding the basics of candlestick analysis, patterns and psychology behind the candles and their structures and patterns will give you a very significant trading advantage over the longer term.

The best book on Japanese Candlesticks (of which I have a copy) is Japanese Candlestick Charting Techniques by Steve Nison. It is really well written and provides a huge amount of charting examples to clearly see candlesticks in action and their expected outcomes.

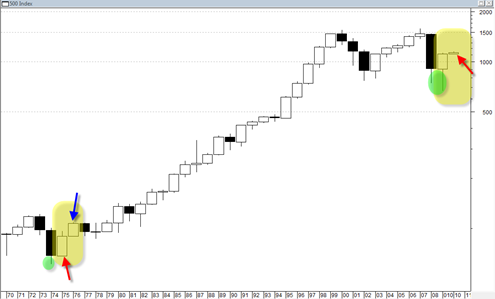
So back to my point about the opening price of the current year 2010 being exactly equal to the low price for 2010.  The actual value for the low and opening is 1116.56 according to my price data (I am assuming that my price data is all correct here otherwise some of the conclusions I make here slightly less meaningful).

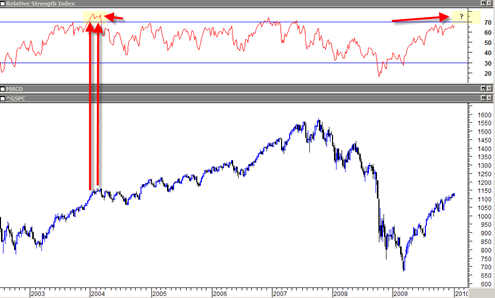
According to my data there was only one other year in the SP500 where the yearly open was exactly equal to the yearly low since 1969.  There are pointed out in the chart below with the two red arrows.

Read more

The Stock Market Will go Up in a Straight Line in 2010

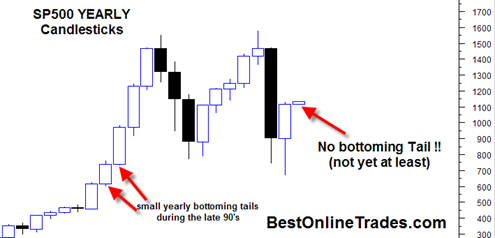
I am kidding of course, but I had to write a catchy title for this post given how we are starting the first day of the new year in the market.  I find it very significant that we ended the 2009 YEARLY price candle only inches away from the high of the YEAR.  And now on the first trading day of the YEARLY 2010 price candle we are in a gap and go situation.  That is an extremely bullish type of candlestick behavior because it does not create any ‘bottoming tails’ on the lower portion candle.

It is true that we can still see some type of selling the next week or two that will create

So far at least we see a huge sign of strength today across the board.  Even the financials (XLF) are rallying after that very long consolidation pattern which could have been seen as a major topping pattern.

Obviously I was stopped out of my TZA position this morning.  And at this point I have decided not to go short again later this week.  In fact I am looking for long side opportunities again. 

One just has to respect the bullish tendencies of this market.  So I think finding long opportunities is the early game plan again for now.  But at the same time being aware that bullish sentiment readings are at record levels and make the long trade a very crowded type of trade.

sp5002010104

Read more

SP500 Set Up for a Wild Monday and First Week of New Year 2010 ?

The charts are saying that this first week of the new year 2010 has the potential to be quite a volatile week.  I am considering the possibility at least that we finally get a meaningful hard down week this first week of January or at least start to see a lot more volatility as compared to last month.

The bollinger bands on the SP500 have contracted into a very narrow band over the last month but they have started to slightly expand.  I suspect that the volatility expansion is going to be to the down side, but a lot really depends on how we close Monday, the first trading day of the new year 2010.

Looking at the uptrend line that has defined this bull run since March 2009 we do see that the SP500 is once again sitting on this uptrend line and at risk of breaking down and through it. 

sp5002010103

Read more

SP500 Yearly Candlestick Chart Shows Bullish Bottoming Tail and Range

sp500yearly

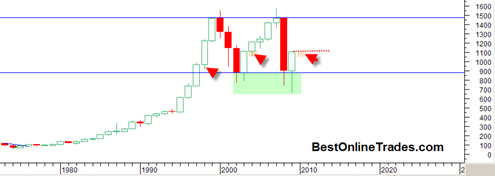
This is a very interesting candlestick chart of the SP500.  It is the YEARLY price candlestick long term chart.  There are few interesting things we can see from this chart.  The most obvious is the very clear long term trading range almost 10 years long.  Despite all the bears endless preaching the fact is that so far at least the market has not been able to break DOWN out of this trading range and therefore keeps the cause building consolidation case intact.  The longer the market trades within this large trading range without breaking down under 900, the better argument can be made that eventually it will break topside.

The other thing to note is the current 2009 yearly candlestick.  This massive yearly candlestick has a large bottoming tail which indicates the strong demand that came in and held prices within the trading range.

Read more

What is the SP500 Index Going to Decide from Here?

sp50020091203

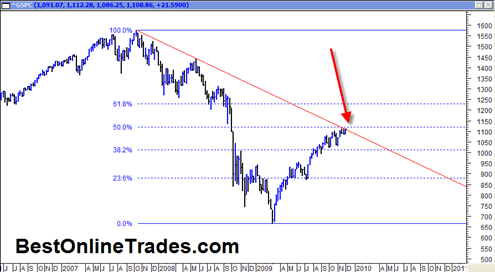
I would be completely remiss if I did not point out once again the important juncture the market finds itself in right now.  The chart above is one which I believe LOTS of people are focusing in on right now.  Why?

Well because the chart above (by the way, it is the weekly price chart) helps to summarize the market in a nutshell and defines some very important parameters that could be very key going forward.

First, it shows the entire extended bear market leg from 2007 into 2008 and then the current massive retracement higher right up to the red colored down trend line that defines this bear market.  So we know that the market at least as defined by the SP500 is perched right under long term resistance.  We also know that this is the THIRD attempt back up to the red down trendline.  The fact that it is the third attempt can be important because usually you will get a successful breakout on third attempts.

Read more