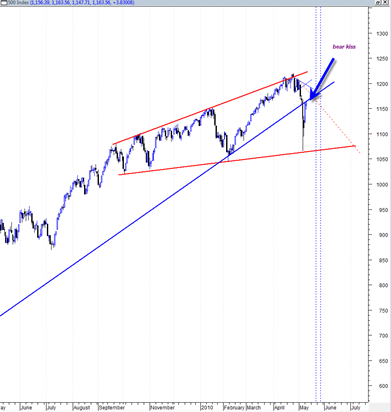
It took me a long time to realize that it is often the most subtle signals the market gives you that have the most meaning. The biggest challenge is figuring out what the market is ‘thinking’ at any moment in time. Usually this is best done by looking at the indicators in combination with price itself. I would say that probably more than half of the time, the daily price signals themselves give enough information combined with volume. But still, that is not enough. One has to add in a little bit of intuition and gut feel on top of everything else. And that seems to get better with time and after looking at enough price action on many different charts.
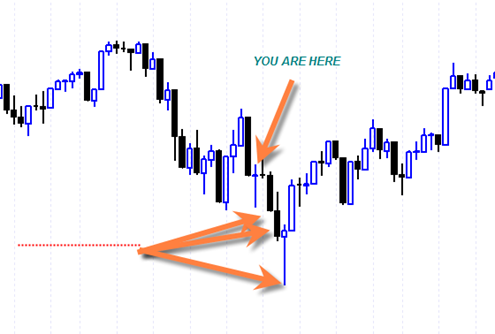
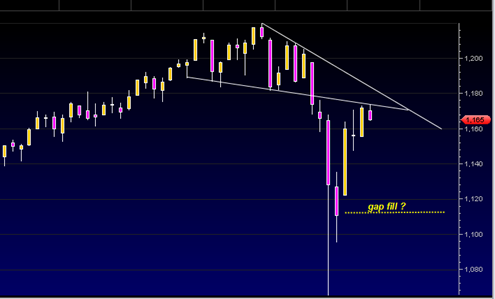
The long legged doji candlestick we printed yesterday on the SP500 was supposed to result in some sort of northward follow through today, but it was not to be seen at all.
During the bull run between March 2009 and April 2010, it seems as though every single reversal doji like that resulted in northward action almost immediately.
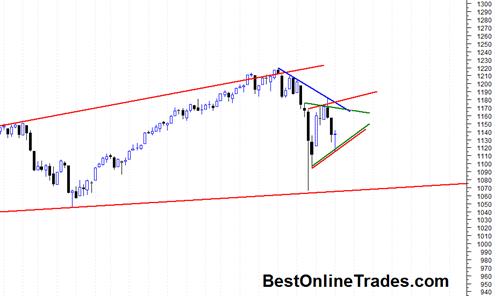
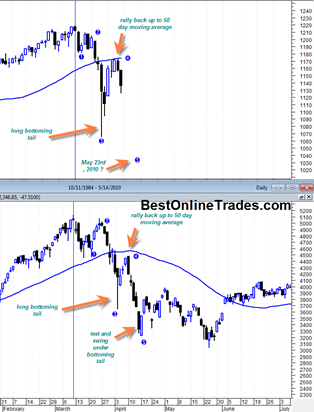
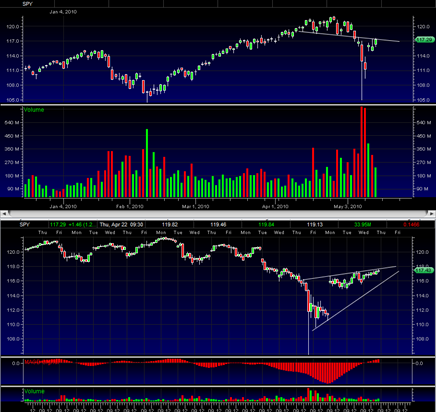
Today that was not the case at all. In fact the market in the early part of the day did get a little bit of a rally going but it was really a weak attempt. I was looking for 1150 or even a huge squeeze all the way to 1170. Making it to 1170 would have formed a small double top formation that would have been consistent with the initial 1930’s automatic rally breakdown and then consolidation.

