A Classic Retest or Something Else

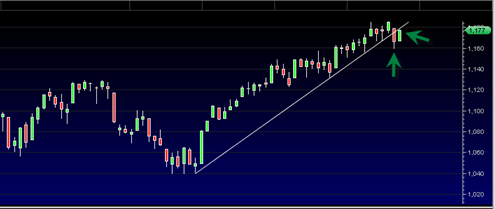
Today the Sp500 (so far at least) is rallying strong right back to the underside of the very steep up trend line that it broke down through yesterday.  This is pretty typical classic type upside reactionary action in this index. Yesterday on the SPY we saw a downward break through of the up trendline on … Read more

So Goes GE So Goes the Market

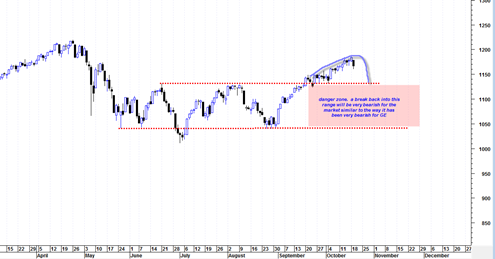
If this omen regarding General Electric Company still holds true then the picture is not looking very good for the sp500.  GE has shown in recent weeks a false upside breakout followed by a very high volume break down and 2B sell signal that was on higher volume than the May 6, 2010 flash crash.  … Read more

BOT Short From the Open

I am keeping the BOT Short Signal right from the Open of sp500 today.  Obviously it would have been better had I kept the signal intact of a few days ago instead of whipsawing myself several times over the last few days.  But I guess that is life, welcome to the market.  More details to … Read more

No Major Sign of Weakness in the Sp500 Yet

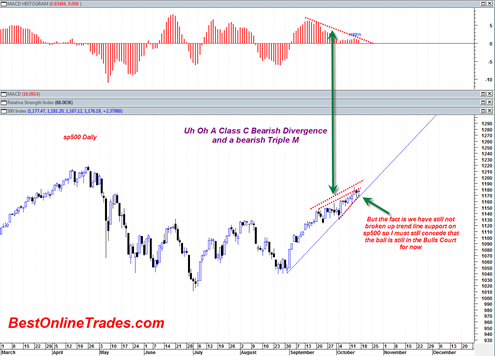
Despite me issuing a BOT Short Signal today I have to confess that by the close today there was no major sign of weakness in the sp500.  On the contrary the market rallied to an almost unchanged close right in the last few minutes.  If the sp500 closes above yesterday’s high of 1184.38 tomorrow then … Read more

Switching to BOT Short Signal Some possible Cracks in the Foundation

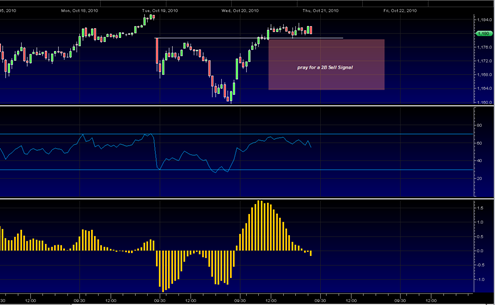
I am switching to a BOT Short Signal right now at 12:06 PM Eastern time at 1173.20 on the sp500.  I am seeing some possible cracks in the foundation of the current uptrend and I think it is prudent to be cautious at this juncture. The NDX is hover right at its 2010 April highs … Read more

Sp500 Rejects Near 1150 Range Again

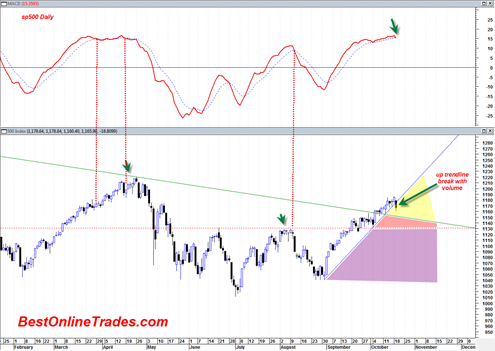
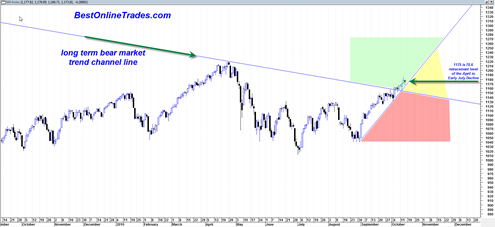
Today the sp500 hit an intra day low of 1155.71.  This was once again a move into the supporting range of 1150.  The sp500 once again today rejected this range and closed higher, signaling more upside to come.  It appears as though the sp500 will be able to jump over 1170 which should imply an eventual test of the April 2010 highs.  Today was the 6th consecutive close above the 2007 3 year bear market channel resistance line.

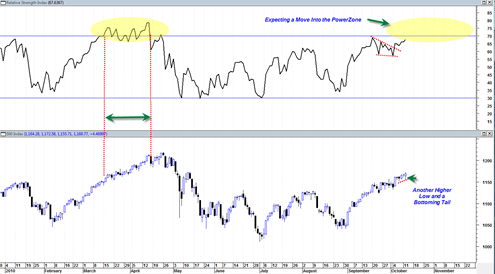
I am currently speculating that the sp500 will move into the RSI power zone above the 70 range at some point in October.  It is also possible that we could remain in the powerzone for a period of time somewhat similar to the behavior of the sp500 during the mid March to mid April 2010 time frame.  During that time frame (yellow highlight) the sp500 ‘trickled higher’ in a slow cumbersome fashion creating a series of higher highs and higher lows for one full trading month.

BestOnlineTrades currently believes this could happen again and it may once again last a full trading month or longer.  It depicts a potential scenario where one sees new shorts entering the market (top picking) and then having to repeatedly cover shorts after the market trends slowly sideways and then starts trickling up again.  Obviously this is not a profitable endeavor.  Shorting a market too early can indeed be quite costly.  And currently my longer term charts are suggesting that an extended bearish trend in the market may be quite a while away into the future.

Read more